
Written by:
Editorial Team
DSG.AI
Data standardization is the process of converting data from different sources into a single, consistent format. It takes data with varied formats, structures, and units and reshapes it into one cohesive model. This is the foundational work required before starting most analytics or AI projects.
Why Inconsistent Data Blocks AI Initiatives
Inconsistent data is a common reason enterprise AI projects fail. Many organizations invest in sophisticated modeling, but the projects stall because the input data is inconsistent. This is not a technical problem; it directly impacts business outcomes.

The volume of data generated makes this problem more difficult. Every minute, people generate large amounts of information, including 500,000 tweets and 510,000 photos on social networks. As Atlan points out in their analysis of data standardization, without a methodical approach to organizing this information, you are collecting unusable digital noise.
The Real-World Impact of Inconsistent Data
Consider a global retail company that wants to use machine learning for demand forecasting. They build a model, but its predictions are inaccurate. This leads to stockouts in some regions and excess inventory in others, resulting in lost sales and increased storage costs.
The data science team investigates for several weeks and finds the cause. Inventory data, pulled from warehouses in North America and Europe, had several inconsistencies:
- The North American system logged inventory in "cases".
- The European system tracked the same products as "individual items".
- Date formats were inconsistent, with some systems using
MM-DD-YYYYand others usingDD-MM-YYYY.
The forecasting model could not reconcile these differences, so it produced incorrect predictions. This is a common example of how a failure to standardize data can directly undermine a business initiative.
Inconsistent data creates a false representation of reality. An AI model trained on this flawed data will amplify existing errors, leading to poor decisions and a loss of trust in data-driven strategies.
The following table highlights common data inconsistencies and their business impact.
Common Data Inconsistencies and Their Business Impact
| Inconsistency Type | Example | Business Impact |
|---|---|---|
| Unit Mismatches | Sales data in USD, EUR, and GBP are mixed in the same column without a currency identifier. | Inaccurate revenue reporting, flawed financial forecasts, and compliance risks. |
| Format Variations | Customer addresses are entered freely: "123 Main St," "123 Main Street," "123 main st." | Failed mailings, duplicated customer records, and an inability to create a unified customer view. |
| Structural Differences | One system exports customer data with a single FullName field; another uses FirstName and LastName. | Incomplete customer profiles, challenges in data integration, and poor personalization efforts. |
| Categorical Ambiguity | Product categories are labeled "Electronics," "Consumer Elec.," and "ELEC" across different datasets. | Ineffective inventory management, unreliable sales analytics, and skewed product performance reports. |
Recognizing these patterns in your data is the first step toward fixing the issues that prevent accurate analysis and reliable AI.
From Cleanup Task to Strategic Work
Learning how to standardize data involves more than cleaning spreadsheets. It is a strategic process that forms the foundation of business intelligence and AI. When your data is consistent, it becomes a reliable, interoperable asset that can be trusted by everyone in the company.
This process ensures that your entire organization—from business analysts to machine learning engineers—is using the same data language. This alignment allows you to build scalable systems and make data-backed decisions.
Before implementing complex algorithms, you must organize your data. A good starting point is to assess your current state. Our guide on how to assess your AI readiness can help you frame this first step, treating data standardization as a foundational investment.
Defining Your Target Data Schema
Standardizing data without a clear plan is ineffective. Before writing transformation code, your team needs to define a target data schema—the single, agreed-upon structure that all your data will conform to. This foundational step is critical for scalable and successful data projects.

This is not a task for a single data engineer. It is a collaborative process. An effective way to build a functional schema is to gather business analysts, domain experts, and data engineers in a cross-functional workshop. This upfront planning is crucial; a well-designed schema can reduce project rework by an estimated 40% to 50%, saving time and resources.
Assembling the Team and Asking the Right Questions
The goal is to create a shared data language for the organization. Business analysts and domain experts understand the operational context—what the data means and how it is used to drive decisions. Data engineers provide a technical perspective, knowing what is possible to implement and what may cause issues.
This group must address fundamental questions for each core business concept, or entity. An entity is a distinct object to be tracked, like a ‘Customer,’ a ‘Product,’ or a ‘Transaction.’
For each entity, you must define:
- Key Attributes: What specific pieces of information are essential? For a 'Customer,' this likely includes
customer_id,email_address,first_name, andregistration_date. - Data Types: What is the precise technical format? Is
customer_idan integer or a string (VARCHAR)? Isregistration_datea DATE, or a full TIMESTAMP with time zone information? - Constraints: What rules must the data follow to be valid? For instance, should an
email_addressbe unique for every customer? Can thefirst_namefield be empty (NULL)?
Agreeing on these details as a team ensures the final schema is technically sound and useful for the business.
A Practical Example of Schema Design
Let’s make this more concrete. Imagine you are pulling customer data from two different systems: a marketing platform and an e-commerce database. Without a standard, the raw data is a mix of conflicting field names and formats.
Here is a comparison of a poorly defined schema and a well-structured, standardized target schema.
| Attribute | Poor Schema (Before Standardization) | Target Schema (After Standardization) |
|---|---|---|
| Identifier | ID (Integer), user_id (String) | customer_id (UUID, Primary Key, NOT NULL) |
| Name | name (String) | first_name (VARCHAR(50)), last_name (VARCHAR(50)) |
| Contact | contact (String) | email_address (VARCHAR(255), UNIQUE, NOT NULL) |
| Location | location (String) | country_iso_code (CHAR(2)) |
| Timestamp | created (String, "05/20/2024") | registration_ts (TIMESTAMP WITH TIME ZONE) |
The difference is significant. The target schema eliminates ambiguity. ID and user_id are consolidated into a single, universally unique customer_id. The vague name field is broken down into first_name and last_name, which is better for analytics and personalization.
Defining a target schema is a strategic act. It creates a single source of truth that powers reliable analytics, prevents data misinterpretation, and builds trust across the organization.
This standardized blueprint becomes the "contract" for all your data pipelines. Any new data source must be mapped and transformed to fit this model. This upfront work prevents the accumulation of "data debt" and ensures that as your systems grow, your data remains a coherent asset.
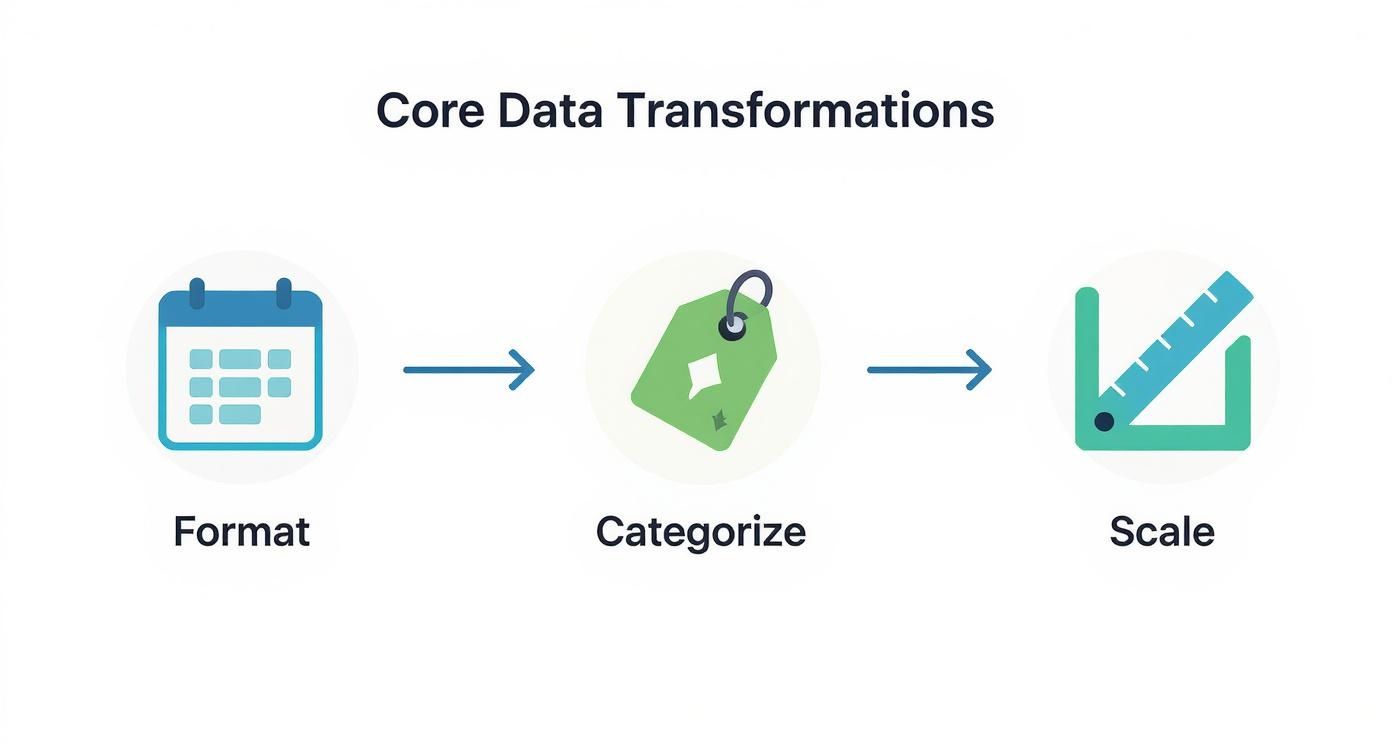
Executing Core Data Transformations
Once you have defined your target schema, the next step is to transform raw data into the designed format. The challenge of creating order from raw information is not new. In 1663, John Graunt analyzed London's mortality data during the plague, one of the first known efforts to standardize public health information to find patterns. You can read about the history of our data civilization on Stephen Wolfram's blog.
Today, we have tools to handle these data transformations, turning inconsistent inputs into reliable assets for AI and analytics.
Normalizing Units and Formats
Inconsistent units and formats are common in raw data. Examples include sales datasets with transactions in USD, EUR, and JPY without a currency column, or log files with a mix of MM-DD-YYYY and YYYY-MM-DD date formats. Machine learning models cannot function with this ambiguity, making normalization an essential first step.
The objective is to convert everything to a single, consistent standard.
For dates, the ISO 8601 format (YYYY-MM-DDTHH:MM:SSZ) is the best practice. It is unambiguous and machine-readable. For measurements, this means picking a base unit—like converting all weights to kilograms or all lengths to meters—and applying it consistently.
Here’s a synthetic example of how you can handle inconsistent date formats using Python’s Pandas library.
# Synthetic Example: Standardizing date strings to ISO 8601 format
import pandas as pd

# Sample data with mixed date formats
data = {'transaction_id': [101, 102, 103],
        'transaction_date': ['05-20-2024', '2024/05/21', '22 May 2024']}
df = pd.DataFrame(data)

# Convert the 'transaction_date' column to a standard datetime object
# The `to_datetime` function can parse multiple formats
df['transaction_date_standard'] = pd.to_datetime(df['transaction_date'])

# Display the standardized dates
print(df[['transaction_id', 'transaction_date_standard']])
This script converts messy date strings into a consistent datetime object. From there, you can format it to the ISO 8601 standard, eliminating ambiguity for your models.
Handling Categorical Variables
Categorical data, such as "Product Category" or "Customer Segment," needs to be converted into numbers before most ML algorithms can process it. Two common techniques for this are label encoding and one-hot encoding. The choice depends on the nature of your data.
- Label Encoding: This method assigns a unique integer to each category (e.g., 'Low' becomes 0, 'Medium' becomes 1, 'High' becomes 2). It is suitable for ordinal variables, where there is a clear order.
- One-Hot Encoding: This approach creates a new binary (0 or 1) column for each category. It is the right choice for nominal variables that have no natural ranking, like 'Country' or 'Color'.
Choosing the wrong encoding method can negatively affect your model. For example, applying label encoding to a "City" column could cause a linear regression model to incorrectly assume that a city with a higher integer value is more important, skewing the results.
Managing Missing Values
Real-world datasets are rarely perfect. Missing values are common. Deleting rows with missing data is usually not a good solution, as it can lead to information loss and introduce bias, especially if the data is not missing at random.
A better strategy is imputation, which means filling in the missing values.
Simple methods like using the mean, median, or mode can work but often distort the data's natural variance. For more critical applications, use more sophisticated techniques. K-Nearest Neighbors (K-NN) imputation, for example, predicts a missing value based on the values of its closest "neighbors" in the dataset. This better preserves the relationships between variables.
Applying Feature Scaling
Feature scaling is another core transformation. It is necessary for many ML algorithms, especially those that rely on distance calculations (like SVMs, K-NN, and clustering) or gradient descent (like linear regression and neural networks). Without scaling, features with larger numeric ranges will dominate the model's learning process.
There are two main tools for scaling numerical features:
- Standardization (Z-score Normalization): This rescales your data to have a mean of 0 and a standard deviation of 1. It is effective when your data follows a normal (Gaussian) distribution and is not overly sensitive to outliers.
- Normalization (Min-Max Scaling): This technique scales your data into a fixed range, usually 0 to 1. This is useful when you need to bound your values or when the data does not fit a normal distribution.
The choice depends on your algorithm and your data. For example, algorithms like Principal Component Analysis (PCA) often perform better with standardization. Image processing tasks, where pixel values are naturally bounded, are a good fit for normalization. Proper scaling ensures that all features contribute equally, leading to more robust and accurate models.
Building Repeatable and Auditable Data Pipelines
Running data transformations on a local machine is a starting point, but the goal is to move beyond one-off manual fixes. The real value comes from embedding your standardization logic into automated data pipelines. This shifts the process from ad-hoc data cleaning to a reliable system that consistently produces high-quality data.
Your pipeline operationalizes the core transformations needed to prepare raw data for analysis.
This flow—aligning formats, encoding categories, and scaling features—is the core of what a repeatable pipeline automates.
Designing a Modern Data Pipeline Architecture
A modern data pipeline is a complete workflow architecture designed for resilience and automation. The process usually starts with ingesting raw data from various sources, runs it through automated transformation and validation steps, and finishes by loading the clean, structured data into a target system like a data warehouse.
A solid architecture includes several key components:
- Orchestration: Manages the schedule, dependencies, and execution of the entire workflow.
- Transformation: Applies business logic to clean, format, and standardize the data.
- Validation: Automated checks to ensure the data meets predefined rules and schema definitions.
- Loading: Moves standardized data to its destination for analytics or AI modeling.
Choosing the Right Tools
The tooling landscape for data pipelines is extensive, with options from open-source frameworks to managed cloud services. The key is to select a combination that fits your team's skills and project scale. You can find a breakdown of workflow automation software.
Some common and effective tools include:
- Apache Airflow: An open-source tool for programmatically authoring, scheduling, and monitoring complex workflows. It is ideal for orchestration, allowing you to define your pipeline as a Directed Acyclic Graph (DAG) of tasks.
- dbt (Data Build Tool): A transformation tool that lets teams transform data directly in their warehouse using SQL. It simplifies testing, documentation, and management of transformation logic.
- AWS Glue: A managed ETL (extract, transform, load) service from Amazon. It is a good choice for building and running pipelines in the cloud without managing infrastructure.
- Great Expectations: An open-source tool for data validation. It allows you to define "expectations" about your data (e.g.,
column_values_to_not_be_null) and automatically runs them in your pipeline to catch quality issues.
Choosing the right tool involves balancing control, cost, and complexity. Here is a comparison of different approaches.
Comparison of Data Pipeline Tooling Approaches
| Tool Category | Example Tools | Best For | Considerations |
|---|---|---|---|
| Open-Source Orchestrators | Apache Airflow, Prefect, Dagster | Complex, custom workflows requiring programmatic control and flexibility. | Requires dedicated infrastructure and engineering expertise to manage and scale. |
| Managed Cloud ETL/ELT | AWS Glue, Google Cloud Dataflow, Fivetran | Teams wanting to minimize infrastructure overhead and build standard data ingestion pipelines. | Can be less flexible for custom logic and may lead to vendor lock-in. |
| Transformation-Focused | dbt (Data Build Tool) | Analytics engineers focused on transforming data after it's loaded into a data warehouse. | Focuses on the "T" in ELT; requires an orchestrator and an ingestion tool. |
| Data Quality & Validation | Great Expectations, Soda | Integrating automated data quality checks into any existing pipeline to prevent bad data. | A specialized component; it validates data but does not move or transform it. |
This table is not exhaustive but highlights different tool philosophies. Many mature data stacks use a combination of these tools, such as using Airflow to orchestrate dbt models and Great Expectations validation steps.
Best Practices for Repeatability and Auditability
Building a pipeline is the first step. Maintaining its reliability and transparency over time requires discipline.
A data pipeline without version control and logging is not auditable. You cannot trust its output because you cannot trace its history or debug failures. True auditability requires a transparent, documented, and repeatable process.
To achieve this level of maturity, your team should adopt two fundamental practices:
- Version Control Everything. Your transformation code, dbt models, Airflow DAGs, and configuration files must be stored in a version control system like Git. This creates a history of every change, which is essential for collaboration and allows you to roll back to a previous state if something breaks.
- Implement Detailed Logging. Every pipeline run should generate comprehensive logs. These logs need to capture critical details: what data was processed, which transformations were applied, how many records were impacted, and which validation checks passed or failed. This is the foundation of data lineage and allows you to trace any data point back to its source.
Keeping Your Standardized Data Clean
Standardizing your data and building pipelines is a significant accomplishment, but the work is not over. The challenge is not the initial cleanup; it is maintaining data quality over time. This requires ongoing governance and monitoring.
Without a plan, even a clean data ecosystem will degrade. New data sources will be added, business rules will change, and schemas will need to evolve. You must shift from a project mindset to a process mindset, where quality is managed daily.
Build Automated Data Quality Checks
Your first line of defense is to build automated quality checks directly into your pipelines. These checks act as gatekeepers, catching problems before they affect downstream dashboards, analytics, and AI models. Relying on an end-user to report that a dashboard "looks weird" is not a reliable strategy.
This means defining what "good" data looks like and then programmatically enforcing it. For example, you can build checks that:
- Enforce Schema Conformance: Does incoming data match the defined column names, data types, and constraints?
- Check for Nulls: Flag records where critical fields—like a
customer_idortransaction_amount—are blank. - Validate Value Ranges: Ensure numbers are within a reasonable range. A product price should not be negative, and an age should not be 999.
- Check Categorical Integrity: If a
country_codecolumn should only contain 'US', 'CA', or 'MX', the check should fail if it finds 'USA'.
Think of these automated checks as smoke detectors for your data pipelines. They alert your team at the first sign of trouble, allowing you to address small issues before they become major problems.
Monitor for Data Drift
Your data reflects the real world, which changes over time. Data drift occurs when the statistical properties of your production data change from the data your models were trained on. This can negatively impact model performance.
One way to monitor for this is to establish a baseline for key data metrics, such as the mean of a feature, its standard deviation, or the percentage of null values. Then, track these metrics over time.
If the average transaction value suddenly increases by 30% in one month, an alert should be triggered. This could indicate a change in customer behavior, a data entry bug, or a system error. Either way, you need to be aware of it immediately.
Make Data Discoverable with a Catalog
As you standardize more data, a new problem arises: how do people find and trust the data you have built? A data catalog can help. It is a searchable inventory of all your data assets.
A good catalog documents everything—your official schemas, clear data definitions, data ownership, and lineage. For an analyst or data scientist, it provides answers to essential questions:
- Where is the official customer dataset?
- What does
customer_lifetime_valuemean and how is it calculated? - Who should I contact if I have a question about this data?
By making your standardized data easy to find, understand, and trust, a catalog drives adoption and discourages the creation of non-standard datasets.
Establish a Data Governance Council
Technology alone cannot solve organizational issues. You need human oversight and clear ownership to maintain data integrity. This often takes the form of a Data Governance Council.
This is a cross-functional team with authority, composed of stakeholders from business, IT, and analytics. Their job is to own the organization's data standards.
They approve changes to target schemas, resolve debates over data definitions, and set official policies for data usage. Forming this council ensures that your investment in standardization is sustained. A formal data governance audit is a good way to map out these responsibilities and create a culture of accountability.
Answering Common Data Standardization Questions
The work of standardizing data often brings up practical challenges when connecting systems and handling real-world information.
Here are some of the most frequent questions from teams working on enterprise data standardization.
What Is The Difference Between Standardization and Normalization?
The terms standardization and normalization are often used interchangeably, but they have different meanings in data science and engineering.
-
Data Standardization is the overall strategy of bringing all your data into a consistent, unified format. This includes defining a target schema, formatting dates as
YYYY-MM-DD, converting all weights to kilograms, and cleaning up categorical values. The goal is to create a single source of truth. -
Data Normalization is a specific, mathematical step within that larger process. In machine learning, it usually means scaling numeric features to a fixed range, like 0 to 1 (often called Min-Max scaling). This prevents features with large values from overpowering those with small values in certain algorithms.
Standardization is the entire process, while normalization is one specific technique. For a refresher on the core concept, see this guide on What Is Data Standardization Explained Simply.
Normalization is a tool used during the broader project of data standardization. Standardization is the goal; normalization is one of many tactics to achieve it.
How Should We Handle New Data Sources?
Imagine you have just finished standardizing your core data systems, and then a new SaaS platform is introduced. Its data does not match your new schema.
The temptation is to build a one-off script to integrate the new data. This approach can lead to a complex system with many exceptions. Instead, you need a formal data source onboarding process, overseen by your Data Governance Council.
A solid onboarding process includes these steps:
- Initial Assessment: Profile the new data. What does it contain? What is its quality? Is it structured or semi-structured?
- Schema Mapping: A data steward or engineer maps the fields from the new source to your existing target schema.
- Gap Analysis: Identify any problems. Which fields in the new source do not fit into your standard model?
- Governance Review: The Data Governance Council makes the final decision. Do we update the target schema to accommodate the new data, or do we transform the non-conforming data to fit existing rules?
This process prevents "schema drift" and ensures your data asset remains consistent over time.
Can Data Standardization Be Fully Automated?
The short answer is no, not completely. While you should automate the execution of your standardization rules, the entire process still requires human involvement.
Automation is effective at applying predefined logic at scale. An ETL pipeline can process millions of records, converting date formats, normalizing units, and running quality checks.
However, some tasks require human intelligence and business context:
- Defining the Standards: Deciding on your target schema is a human task. It requires business knowledge, domain expertise, and agreement among different teams.
- Handling Ambiguity: If an address field contains "N/A," an automated script cannot determine if it is a true missing value or a data entry shortcut.
- Managing Complex Edge Cases: Merging complex customer profiles with slightly different information or interpreting free-text comments often requires a person to make a nuanced decision.
A human-in-the-loop system is the best approach. Aim to automate 95% of the repetitive, rule-based work. This frees up your data experts to focus on the complex 5% where their judgment adds the most value.
At DSG.AI, we design and build enterprise-grade AI systems that turn complex data challenges into measurable business value. Our architecture-first approach ensures your data pipelines are scalable, reliable, and built for the long term. Learn more about our production AI projects.