
Written by:
Editorial Team
Editorial Team
Poor data quality is the single greatest threat to a successful AI program. It introduces financial and operational risks that can sink even the most promising initiatives. For a Chief Information Officer, this is not a technical chore to delegate. It is a strategic imperative for unlocking business value and avoiding the high costs of unreliable data.
Why Data Quality Is a Critical AI Investment
Building an AI system on unreliable data is like constructing a skyscraper on shifting sand. The architecture may be brilliant, but the structure is destined to fail. Data quality management is the systematic process of ensuring your data is accurate, consistent, and fit for its intended purpose. It provides the solid foundation required for any successful digital or AI initiative.

When data quality is an afterthought, the consequences affect the entire organization. The results are flawed business intelligence, machine learning models that fail in production, and a significant waste of resources. This guide provides a clear path to turn unpredictable data into a competitive advantage.
The Cost of Inaction
The financial impact of poor data is significant. One 2016 IBM estimate suggests the annual cost of bad data to the U.S. economy is $3.1 trillion. This cost directly affects operational efficiency, strategic planning, and bottom-line results. For companies investing heavily in AI, the stakes are higher.
Based on a 2021 study by MIT Sloan Management Review, organizations with mature data quality practices see five times higher AI ROI compared to their peers. This is especially vital for operations in sectors like mining or agriculture, where predictive models depend entirely on accurate datasets.
Despite this, a trust gap persists. While a 2022 survey by Seagate found that 77% of companies are actively pursuing data-driven goals, many are held back by a lack of trust in their information. This discrepancy makes robust governance and data quality management a necessity.
With enterprise data volumes projected to increase by 2.5x by 2027 (source: IDC), a proactive strategy is the only way to prevent costly failures and ensure AI success. You can explore more on the financial impact of data quality tools in recent market analysis.
Shifting From a Technical Task to a Business Strategy
Viewing data quality management as purely an IT function is a common mistake. It is a cross-functional discipline that demands alignment between technical teams and business leaders. The goal is not just to clean data reactively; it is to embed quality into the entire data lifecycle from the start.
This strategic approach involves several key actions:
- Establishing clear ownership: Assigning accountability for critical data assets ensures that quality is actively managed.
- Defining quality standards: This means creating universal, documented rules for what constitutes "good" data across the enterprise.
- Implementing continuous monitoring: Using automated tools to detect and remediate issues before they can derail business operations is essential.
By framing data quality as a strategic enabler, organizations can build the resilient foundation needed for innovation and sustainable growth.
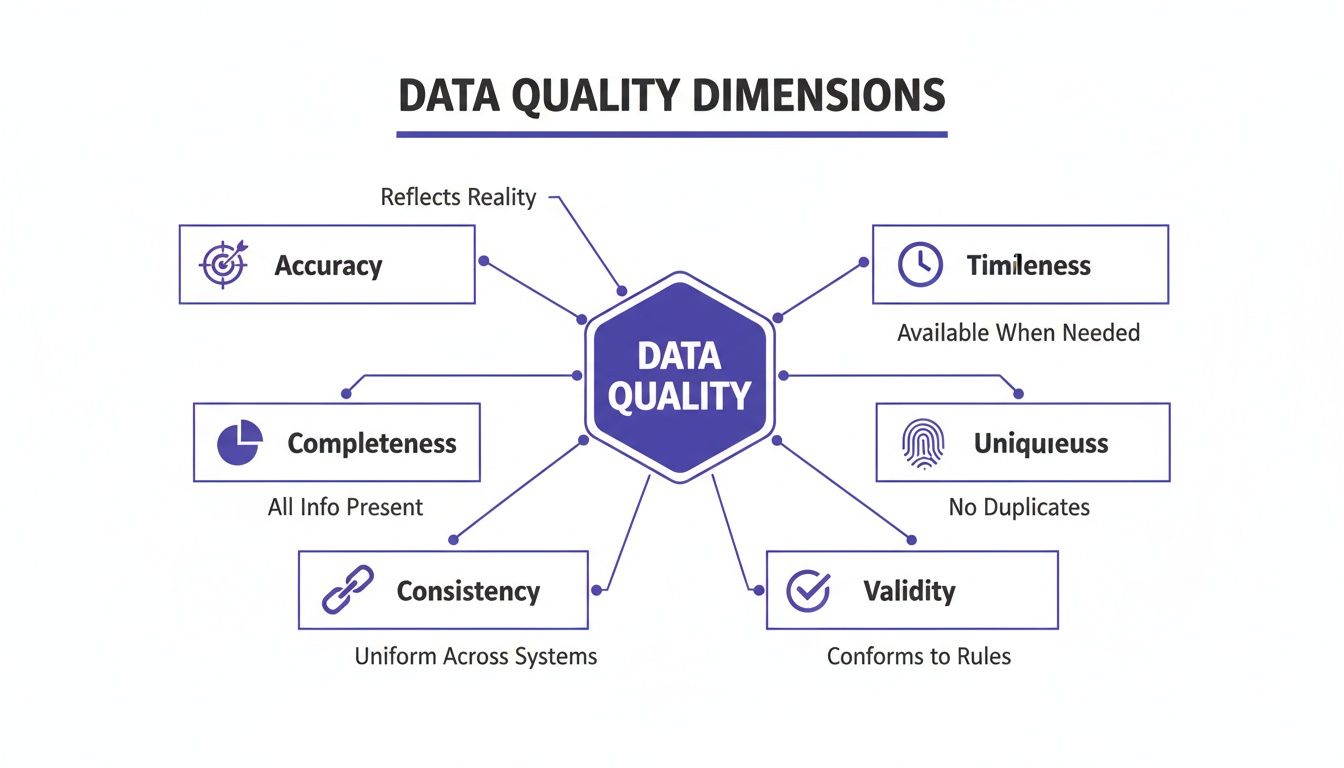
The Six Dimensions of High-Quality Data: A Practical Breakdown
Before you can fix bad data, you need a shared vocabulary to describe what "good data" looks like. The concept can be abstract, so it is often broken down into six core, measurable dimensions. These are the fundamental building blocks of trustworthy data.
A failure in any one of these dimensions has an immediate business impact. In e-commerce, a typo in a shipping address results in a lost package and a dissatisfied customer. In sales, an incomplete customer record can invalidate a forecast. These are not minor IT issues; when they happen thousands of times a day, they become a drag on revenue and efficiency.
Let's review what each of these six dimensions means in practice.
Accuracy and Completeness
Accuracy is simple: does the data reflect reality? An accurate record is factually correct. For a logistics company, this means the address in their CRM is the actual, physical location of the customer. If it is incorrect—even by a single wrong number in a zip code—deliveries fail, shipping costs rise, and customer service calls about missing packages can spike by 5-8% based on industry benchmarks.
Completeness asks if all critical information is present. A dataset is complete only if it has enough detail to be useful. Consider a retail customer profile with a blank phone number field. That missing information can prevent SMS marketing, break two-factor authentication, and make it impossible for support to return a call. Key parts of the customer journey stop working.
Synthetic Example: A sales team is building its Q4 forecast. They pull lead data from a recent marketing campaign and find that 25% of the records are missing the "company size" field. They are forced to make assumptions, which makes the forecast less reliable and could lead to a 10-15% misallocation of sales resources for the quarter.
Consistency and Timeliness
Consistency ensures that your data does not contradict itself across different systems. If your CRM says a customer lives on "Main Street" but your billing system says "Main St.", that is an inconsistency. This can cause billing issues, payment delays, and a fragmented customer view that affects both sales and service teams.
Timeliness measures how current your data is. For important decisions, you need information that reflects current conditions. In finance, stock data that is a few seconds late is not useful for high-frequency trading. The same principle applies in marketing; a team that follows up on a lead within five minutes has a significantly higher chance of conversion than one that waits three weeks, as shown in studies by LeadResponseManagement.org.
Uniqueness and Validity
The last two dimensions, uniqueness and validity, maintain the integrity of your records and ensure they follow defined rules.
Uniqueness means no duplicates. Every customer in your database should have one master record. When you have duplicates, you inflate your customer count, skew your analytics, and risk mistakes like sending the same person the same promotional email multiple times. Cleaning up duplicates can reduce marketing waste by an estimated 8% to 12%.
Finally, validity is a check to see if the data is in the right format. A valid email address must have an "@" symbol. A date of birth field needs to be a real date, not text. Invalid data can break workflows, crash applications, and force manual intervention, which slows down operations.
To summarize, here is an overview of these six dimensions and their real-world risks.
The Six Core Dimensions of Data Quality and Their Business Impact
| Dimension | Definition | Example of Poor Quality | Business Impact |
|---|---|---|---|
| Accuracy | The degree to which data correctly represents the real-world entity it describes. | A customer’s shipping address in the CRM does not match their physical location. | Failed deliveries, increased logistics costs, and customer dissatisfaction. |
| Completeness | The extent to which all required data is present. | A lead record is missing a phone number or email address. | Ineffective marketing campaigns, broken communication channels, and lost sales opportunities. |
| Consistency | The uniformity of data as it moves across different systems and applications. | A product is listed with different prices in the e-commerce store and the inventory system. | Billing errors, poor customer experience, and unreliable financial reporting. |
| Timeliness | The degree to which data is up-to-date and available when needed. | Inventory levels are only updated once every 24 hours, leading to stockouts. | Lost sales, poor resource planning, and decisions based on outdated information. |
| Uniqueness | The absence of duplicate records for the same entity within a dataset. | The same customer exists three times in a database with slightly different names. | Wasted marketing spend, skewed analytics, and a fragmented customer view. |
| Validity | The extent to which data conforms to a defined format, type, or range. | A phone number field contains letters, or a date is entered as "N/A". | Application errors, failed data integrations, and broken automated processes. |
Mastering these six dimensions is a business discipline required to build trust in your data and the decisions you make with it.
Building Your Enterprise Data Governance Framework
Moving from theory to practice requires a solid plan. A data governance framework is a business-led system that integrates data quality into your company's daily operations. It establishes the rules for how data is created, handled, and used by everyone.
This framework is the essential structure for your data quality program. Without it, efforts can become siloed and inconsistent. A well-designed governance structure ensures everyone understands their role in treating data as a critical company asset.
Establishing Clear Roles and Responsibilities
The first step toward building a lasting framework is to assign clear ownership. When no one is accountable, data quality suffers. A business-led approach is crucial because it empowers the people who are closest to the data and understand its business impact.
This means defining specific roles:
- Data Owners: These are senior leaders, such as VPs or Directors, who have ultimate responsibility for the data within their domain. For instance, the VP of Sales owns all customer data. They approve policies and secure the necessary resources.
- Data Stewards: These are subject matter experts embedded within business teams. They are the day-to-day managers of data quality—defining standards, identifying issues, and overseeing remediation.
- Data Governance Council: This is a cross-functional team of data owners and other key leaders. The council meets regularly to align on company-wide data policies, resolve cross-departmental conflicts, and ensure governance efforts support the company's strategic goals.
This governance structure protects the core dimensions of your data.
Each of these six dimensions represents a potential risk that a strong governance team must proactively monitor and manage.
Creating Practical Processes and Policies
Once roles are set, the next step is to equip your team with the necessary processes and policies. These must be practical, enforceable, and easy for business users to follow. The goal is to make correct data handling the path of least resistance.
Here are a few essential processes to establish:
- Issue Identification and Remediation: You need a clear, documented workflow for how data quality problems are found, reported, prioritized, and fixed. This should include service-level agreements (SLAs) for resolving critical errors.
- Data Standardization: This involves creating a "single source of truth" for definitions and formats. For example, a policy might state that all U.S. state fields must use the two-letter abbreviation, eliminating inconsistencies.
- Access Control: Define and enforce rules about who can view, create, or change data. This is fundamental for protecting sensitive information and ensuring changes are made only by authorized personnel.
To improve your framework, exploring established data governance best practices can offer actionable advice, especially for data-heavy industries.
Synthetic Example: Financial Services Governance A global investment bank establishes a Data Governance Council to address the quality of data feeding its credit risk models. The Chief Risk Officer (CRO) is named the Data Owner for all risk data. A senior analyst from the risk modeling team becomes the Data Steward. Their first policy mandates that all counterparty data must be cross-checked against an approved third-party source before use in any new model. As a result, the bank reduces its model error rate by 12% in the first year.
This scenario shows how a formal governance structure turns abstract goals into specific, measurable actions that deliver business value.
A Practical Roadmap to Implement Data Quality Management
Improving data quality is a structured journey, not a one-off project. You need a methodical approach that connects technical work to business results. By following a proven sequence, you can move from identifying data issues to embedding continuous quality checks into your daily operations and AI pipelines.
This roadmap breaks the journey into five manageable phases, each designed to build momentum and deliver measurable value.
Phase 1: Assessment and Discovery
You cannot fix what you do not understand. The first step is a thorough assessment of your current data landscape to establish a baseline. This involves using data profiling tools to scan critical databases and applications to uncover the state of your data.
The goal is to quantify the problem. Your assessment should answer specific questions:
- What are our most common data quality issues? (e.g., 22% of customer records are missing a phone number).
- Where are these issues originating? (e.g., a specific web form or a faulty API integration).
- What is the initial scope of the problem? (e.g., duplicate records affect an estimated 15% of our main CRM).
This data-driven discovery provides the evidence needed to build a business case for investment and prepares you for the next phase.
Phase 2: Prioritization and Focus
Attempting to fix everything at once is a common reason for failure in data quality initiatives. Instead, prioritize ruthlessly. Focus your energy on the critical data assets that have the largest impact on key business outcomes.
To determine priorities, talk to business leaders. Identify the data that fuels their most important processes. For a retail company, this is likely product and customer data. For a logistics firm, it is shipment and location data. By focusing on these high-value datasets first, you can demonstrate a clear and fast return on investment.
For instance, a manufacturing company might find that inaccuracies in supplier data are directly causing production delays. By prioritizing the cleanup of this single data domain, they can target a specific outcome, such as reducing raw material delivery delays by 10-18% from their Q1 baseline.
Phase 3: Tooling and Integration
Once you know where to focus, you can select the right technology. The global data quality management software market was valued at $2.23 billion in 2024 and is projected to reach $6.89 billion by 2033 (source: Straits Research). This growth is not surprising, as Gartner has previously estimated that poor data quality costs large firms an average of $15 million a year. You can dig deeper into these trends in the data quality software market.
Modern tools automate many manual processes. They handle tasks like:
- Automated Profiling: Continuously scanning data to flag anomalies.
- Cleansing and Standardization: Applying rules to correct mistakes and enforce consistent formats.
- Deduplication: Using algorithms to find and merge duplicate records.
The key is to choose tools that integrate smoothly with your existing systems, from your CRM to your data warehouse. For complex workflows, understanding how a robust data orchestration platform can help is a critical step.
Phase 4: Remediation and Cleansing
This is where the cleanup begins. Using insights from your assessment and your new tools, your team can start fixing historical data issues. This is typically a mix of automated fixes for widespread errors and manual review for more sensitive data.
This step is critical for restoring trust in your data. By systematically cleansing your core assets, you provide your analytics and operational teams with a reliable foundation. This effort can lead to tangible results, such as reducing order-to-cash cycle times by 8-15 percent by improving the accuracy of customer data.
Phase 5: Continuous Monitoring and MLOps Integration
Data quality management must be an ongoing discipline. This means embedding automated quality checks directly into your daily workflows and data pipelines. The goal is to catch and fix problems at the source, before they can contaminate your systems.
For any organization using AI, this step is non-negotiable. Integrating data quality checks directly into your MLOps pipelines is the only way to prevent model drift. When the quality of input data decays, the performance of AI models will decline. Continuous monitoring acts as an early warning system, helping to ensure your models remain accurate and reliable.
Navigating Data Quality and AI Compliance
As AI becomes central to business operations, the regulatory landscape is evolving. For enterprise leaders, data quality management is no longer just a best practice for operational efficiency—it is now a cornerstone of legal and regulatory compliance.
The most prominent example is the EU AI Act. If your organization deploys a "high-risk" AI system in the European Union, the Act's rules on data quality are legal mandates. This reframes the conversation, moving it from internal performance goals to externally-auditable compliance.
The EU AI Act and Its Data Quality Mandates
The EU AI Act specifies that high-risk AI systems must be trained, validated, and tested with data that meets rigorous quality standards. This makes data quality a critical concern for governance, risk, and compliance (GRC) teams. Regulators will demand verifiable proof of compliance.
The Act specifically calls for:
- Data Governance and Management: You must establish and document your practices for data collection, handling, and monitoring across the entire AI lifecycle.
- Accuracy and Representativeness: Training datasets must be accurate, complete, and free from errors. They must also be representative enough to ensure the model does not incorporate biases that lead to discriminatory outcomes.
- Relevance: The data must be relevant and suitable for the AI system’s intended purpose.
Non-compliance carries a steep price. Penalties can reach as high as €35 million or 7% of global annual turnover, whichever is greater. Preparing your organization is not optional. You can explore a detailed approach in our guide to EU AI Act readiness.
From Best Practice to Legal Necessity
This new wave of regulation highlights a critical gap in many companies. A 2022 survey from Wakefield Research found that while 77% of data professionals prioritize data-driven decisions, only 46% have full trust in their data. Furthermore, a 2020 study by HFS Research reported that 70% of respondents point to data quality as their biggest roadblock.
In the context of AI, that trust gap is a significant risk. Bad data can invalidate an entire AI model.
Synthetic Example: A Healthcare AI System
A hospital uses an AI model to predict which ICU patients are at risk of sudden deterioration. Under the EU AI Act, this is a "high-risk" system. Before it can be used, the hospital must produce an auditable trail showing its training data was accurate, complete, and representative of its patient population. This includes proving the data was free from biases tied to age, gender, or ethnicity that could cause the model to perform poorly for certain groups.
In this situation, solid data quality management is not just about making the model more accurate. It is the requirement for legally deploying the system. Transparent, verifiable data quality is the foundation for safe, ethical, and compliant AI, reducing GRC risks and earning the trust of regulators and patients.
How to Measure the Success of Your Data Quality Program
A data quality program's value is determined by the results it delivers. To justify the investment, you must connect technical cleanup efforts to real-world business outcomes. It is not enough to talk about "clean data"; you need to measure progress with key performance indicators (KPIs) that are meaningful to the business.
A good approach is to split your metrics into two connected categories. This helps you track the direct impact of your data quality work and translate those wins into the financial and operational language that leadership understands.
Technical Performance Metrics
Technical KPIs provide a direct look at the health of your data and the effectiveness of your management program. These metrics quantify improvements in the datasets themselves and serve as leading indicators of future business impact.
Here are a few essential technical metrics to monitor:
- Error Rate Reduction: The percentage decrease in specific data flaws—such as invalid email formats or incorrect zip codes—compared to a baseline. A goal could be to achieve a 30% reduction in formatting errors within your customer database in one quarter.
- Data Completeness Percentage: This measures the proportion of records with all critical information filled in. For example, you could aim to increase the completeness of the "phone number" field in your sales lead list from 75% to 95%.
- Duplicate Record Reduction: This tracks the percentage decrease in duplicate entries in a dataset. A reduction in this number is proof that you are moving closer to a single source of truth for customers or products.
Business Outcome Metrics
Technical metrics are important, but the ultimate goal is to show how better data improves business performance. This is where business metrics are essential. Understanding the importance of analytics and reporting in business is key to demonstrating a clear return on investment.
These metrics link cleaner data directly to operational success:
- Operational Cost Reduction: This connects data accuracy to tangible savings. For example, a 10% reduction in shipping address errors could directly cause a 5% decrease in logistics costs due to fewer returned packages.
- Improved Customer Satisfaction (CSAT): High-quality data enables better personalization and service. You can track how improving data completeness in your CRM correlates with a measurable lift in your CSAT scores.
- Increased Campaign Conversion Rates: With more accurate and de-duplicated customer records, marketing efforts become more effective. A successful initiative could show a 15% reduction in duplicate contacts, leading to a 3% increase in email campaign conversion rates.
Monitoring both types of metrics turns a one-time cleanup project into a sustainable advantage. It provides the quantifiable proof needed to show that the program is creating real value. To see how your own data stacks up, you can learn more by exploring a comprehensive data quality audit.
Frequently Asked Questions About Data Quality Management
When leaders first engage with data quality, a few key questions often arise. Here are straightforward answers to common hurdles.
Where Should We Start With Data Quality Management?
Start small. Avoid a massive, company-wide overhaul. Instead, select one high-value business problem where poor data is the known cause. This approach is about securing a quick, measurable win.
For instance, focus on a critical data domain like customer or product records. If you can show that cleaning this one area reduces shipping errors by 5-8% or increases the ROI on a marketing campaign, you have built a powerful case study. This is how you gain the buy-in to expand the program.
How Do You Build a Business Case for This Investment?
A compelling business case quantifies the cost of inaction. Frame data quality not as a technical expense but as a business initiative that reduces risk and enables growth. The argument should focus on concrete financial outcomes.
To do this, calculate the real-world costs of bad data:
- Operational Waste: Sum the money lost from misdirected shipments, returned packages, or marketing spend on duplicate contacts.
- Failed Strategic Projects: Identify analytics or AI projects that have stalled or under-delivered due to unreliable data.
- Compliance Penalties: Model the financial risk of fines for not meeting data regulations, such as those in the EU AI Act.
Presenting the numbers this way shifts the conversation from a technical fix to a business priority.
A common mistake is focusing only on technical metrics. The most powerful business cases connect data quality improvements directly to business KPIs. For example, show how a 15% decrease in data entry errors shortens the order-to-cash cycle by 7%.
Can We Use AI to Improve Our Data Quality?
Yes. It is one of the most effective ways to manage data quality at scale. While rule-based systems are still useful, AI and machine learning models can spot and fix complex issues automatically. This creates a feedback loop: better data improves AI models, and those models help maintain even better data.
Modern AI can automate several key tasks:
- Advanced Anomaly Detection: Finding subtle outliers in large datasets that rules would miss.
- Complex Deduplication: Identifying and merging duplicate records with slight variations in names or addresses.
- Intelligent Data Imputation: Using algorithms to predict and fill in missing values with a higher degree of accuracy than simple averages.
By incorporating AI into the process, you can move from reactive data cleanup to a proactive, continuous quality engine.
At DSG.AI, we help enterprises design, build, and operationalize AI systems that deliver measurable business value. Our architecture-first approach ensures your AI initiatives are built on a foundation of high-quality, reliable data, turning your information into a true competitive advantage. Learn how we can help you build your next high-impact AI solution at https://www.dsg.ai/projects.