
Written by:
Editorial Team
Editorial Team
Data quality metrics are standards used to measure the condition of data. They are specific, quantifiable checks that report if information is fit for its purpose—whether it’s complete, accurate, consistent, timely, unique, and valid enough to run business operations and train AI models.
Think of them as the vital signs for an organization's data assets.
Why Data Quality Metrics Are Your AI Insurance Policy
Enterprise AI projects often fail not because algorithms are too complex, but because the underlying data is unreliable. Poor data quality is the single biggest obstacle to building AI that delivers business value.
For a technology leader, the first step is to treat data quality as a strategic imperative, not a backend chore.
Consider data quality metrics the insurance policy on your AI investments. Without them, you are building on a shaky foundation. Your models will produce faulty insights, users will lose trust, and financial and reputational risks will mount.
The Staggering Cost of Unchecked Data
The financial drain from poor data quality is significant. Gartner’s research estimates the average cost at $12.9 million per year for each organization. This figure comes from flawed business decisions, operational inefficiencies, and missed opportunities.
A Harvard Business Review study found that only 3% of companies' data meets basic quality standards. These figures reveal a disconnect: companies invest heavily in AI talent and infrastructure but often neglect the most critical component—clean, reliable data.
Safeguarding AI with Measurement
The practical way to protect AI investments is to implement a framework for measuring data quality. This shifts data management from a reactive, fire-fighting mode to a proactive discipline that drives value.
With the right metrics, you get objective proof to:
- Build Trust: When you can demonstrate data is clean, data scientists and C-suite executives gain confidence in the outputs.
- Mitigate Risk: Verified data lowers the risk of biased or incorrect AI results that can damage your brand or attract regulatory scrutiny.
- Ensure ROI: High-quality data is a prerequisite for AI models that perform as expected and deliver the intended business outcomes.
Understanding the quality of inputs is non-negotiable. For example, the importance of vetting and validating LLM training data shows you cannot afford to guess.
Ultimately, setting up and monitoring data quality metrics is the most direct path to turning AI experiments into dependable, production-ready business solutions.
The Six Data Quality Dimensions Every CIO Must Master
To manage data quality, we must break it down into measurable components. Similar to building an engine, you don't just say "it works." You measure horsepower, torque, and fuel efficiency. High-quality data is what you get when you master six core dimensions.
These are not just technical terms; they are business concepts that answer fundamental operational questions. By approaching them as a unified framework, you can turn abstract quality goals into a concrete action plan to protect your AI investments. This hierarchy shows how core metrics form the foundation for data quality, which is non-negotiable for AI success.
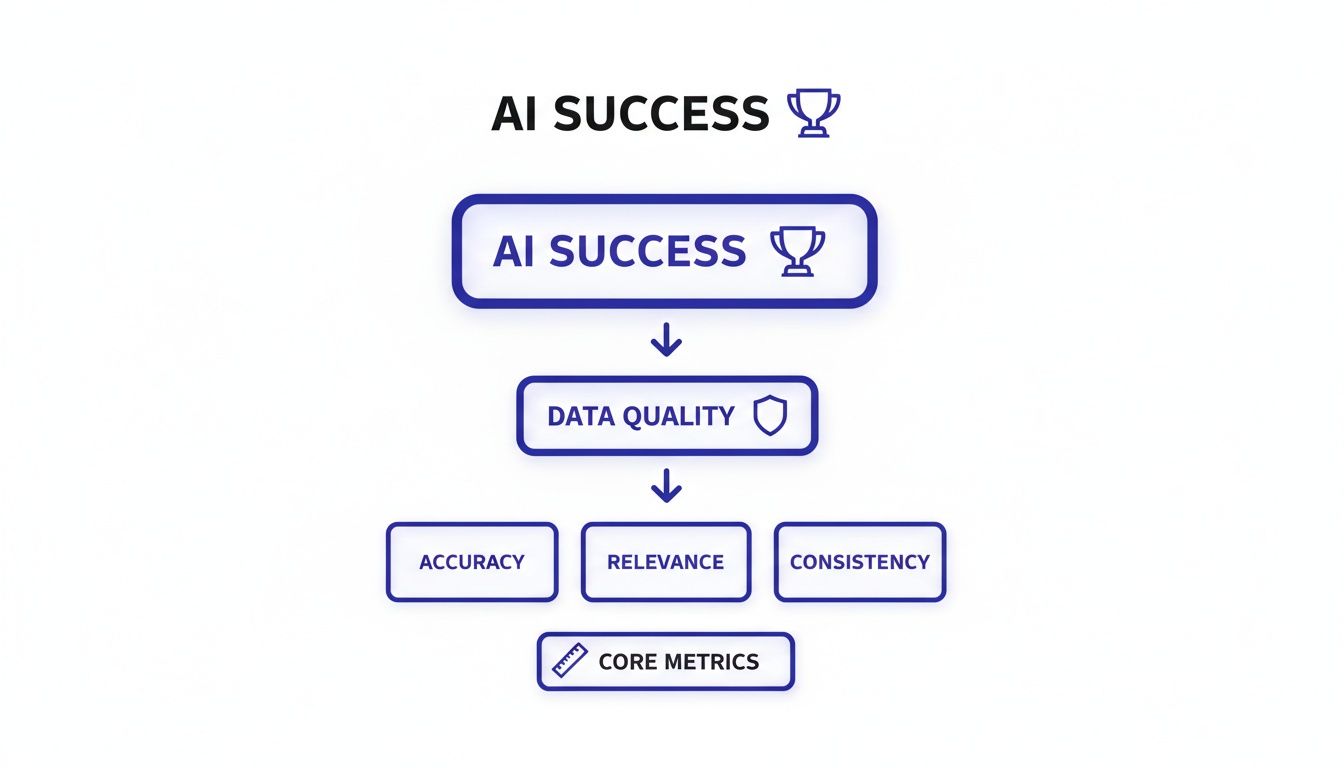
The diagram makes it clear: reliable AI is a result of enforcing data quality standards, which are built on specific, quantifiable metrics.
Before examining each dimension, this table provides a high-level overview. It connects each concept to its impact on AI and offers a simple question to frame your thinking.
| Dimension | What It Measures | Impact on AI | Key Question |
|---|---|---|---|
| Completeness | The presence of all required data. | Missing data leads to skewed models that cannot see the whole picture. | Is all the critical information present? |
| Accuracy | The degree to which data reflects reality. | Inaccurate data teaches the AI the wrong lessons, causing bad decisions. | Does this data reflect what’s true in the real world? |
| Timeliness | The freshness and availability of data. | Stale data makes AI-driven decisions irrelevant and ineffective. | Is this data current enough to be useful right now? |
| Consistency | The uniformity of data across different systems. | Contradictory data confuses AI, preventing a unified view of an entity. | Does the same information match across all our systems? |
| Uniqueness | The absence of duplicate records. | Duplicates artificially inflate counts and skew analytical models. | Is each entity represented only once? |
| Validity | The data's conformance to defined formats and rules. | Invalid data can break pipelines or corrupt model inputs. | Does this data follow our required format and business rules? |
This framework provides a shared language and a clear path forward. Now, let’s explore what each dimension means in the context of building and deploying enterprise AI.
1. Completeness
This dimension asks a basic question: Is all the critical information present?
Completeness measures the percentage of required data fields that are filled. It is the first and simplest check you can run.
Why It Matters for AI: AI models learn from patterns in data. If a large portion of records is missing key attributes, the model learns from a distorted, incomplete version of reality. A predictive maintenance model trained on spotty sensor logs might miss the true signals of an impending equipment failure.
Synthetic Example: A retail company’s recommendation engine is fed customer data where 30% of "past purchases" fields are null. The model cannot see the full buying history for these customers. This leads to irrelevant product suggestions and a 15% lower click-through rate compared to models trained on the complete dataset.
2. Accuracy
The key question is: Does the data reflect what is true in the real world?
Accuracy measures how well your data represents reality. An address is accurate if a package can be delivered there. A sales figure is accurate if it matches transaction records.
Why It Matters for AI: Inaccurate data is often worse than no data because it actively teaches the model the wrong things. An AI model for credit risk trained on faulty income data will make poor decisions—approving high-risk applicants or denying creditworthy ones, leading to financial losses and regulatory risk.
The scale of this problem is large. Some estimates suggest that only 3% of enterprise data meets basic quality thresholds, leaving 97% as potentially problematic. This data issue grows with the number of connected IoT devices—projected to hit 18.8 billion by the end of 2026—generating large volumes of data. You can explore more on this from teams monitoring millions of data tables.
3. Consistency
For consistency, we ask: Does the same piece of information match across different systems?
Consistency ensures that a specific data point is the same wherever it appears. If a customer's name is "John Smith" in the CRM but "Jonathan Smith" in the billing system, you have an inconsistency problem.
Why It Matters for AI: AI systems frequently pull data from multiple sources to build a complete picture. Inconsistent data breaks that unified view. A fraud detection algorithm might see transactions from "John" and "Jonathan" as two separate people, failing to connect a pattern of suspicious activity.
4. Timeliness
The central question for timeliness is: Is the data current enough to be useful for its purpose?
Timeliness, or data freshness, measures the delay between a real-world event and the data about that event being ready for use.
Why It Matters for AI: Many AI models rely on real-time or near-real-time information to make relevant decisions. A logistics model trying to optimize today's delivery routes using last week's traffic data is operating on stale information. It will be ineffective, leading to higher fuel costs and missed delivery windows.
Synthetic Example: A maritime shipping firm's fuel optimization AI needs weather data updated hourly to be effective. Due to a pipeline delay, the model gets updates only once every six hours. This lag causes the model to miss short-term weather shifts, leading to suboptimal routing and an estimated 5% to 8% increase in quarterly fuel consumption.
5. Uniqueness
Here, you're checking one thing: Is each record or entity represented only once?
Uniqueness is about making sure there are no duplicate records in a dataset. Every customer, product, and transaction should have one authoritative entry.
Why It Matters for AI: Duplicate records are detrimental for analytics and model training. If a customer exists three times in a database, any AI model will count their behavior and value three times. This leads to flawed customer lifetime value calculations and misallocated marketing budgets.
6. Validity
Finally, for validity, we ask: Does the data conform to the required format and business rules?
Validity checks whether data is stored in the correct format and falls within acceptable business parameters. This covers data types (e.g., a number in a numeric field) and adherence to business logic (e.g., an order date cannot be in the future).
Why It Matters for AI: Invalid data can stop data processing pipelines or inject nonsensical values into a model. An AI forecasting model that ingests an invalid date format might misinterpret seasonality, leading to inaccurate inventory predictions and costly stockouts or overstock situations.
Putting Data Quality Theory Into Practice
Knowing the six dimensions of data quality is a start, but theory does not fix a broken data pipeline. The work begins when you turn these concepts into concrete, measurable actions. This means defining exact formulas and writing code that reports on data health, transforming abstract goals into specific engineering tasks.
The goal is to stop saying "our data should be more complete" and start declaring that "customer email address completeness must exceed 98%." This is when data quality shifts from a concept to an operational discipline with clear thresholds, Service Level Agreements (SLAs), and accountability.
How to Calculate Core Data Quality Metrics
For each of the six dimensions, we can set up a standard formula and a practical query. The following examples, written in SQL and pseudocode, can be used by data engineering and analytics teams. They offer a straightforward, repeatable way to measure the health of important datasets.
1. Completeness
Completeness is about the presence of values. The most direct way to measure it is to calculate the ratio of non-null values to the total number of records for a specific column.
Formula:
(Number of Non-Null Values / Total Number of Rows) * 100
A high percentage indicates a well-populated dataset. A low score signals gaps that could warp AI model training.
SQL Example:
This query calculates the completeness percentage for the email_address column in a customers table.
SELECT
  (COUNT(email_address) * 100.0 / COUNT(*)) AS email_completeness_percentage
FROM
  customers;
2. Accuracy
Accuracy asks if the data reflects reality. To measure it, you typically need to compare your data against a trusted external source or a predefined set of validation rules.
Formula:
(Number of Accurate Records / Total Number of Records) * 100
Pseudocode Example: Because accuracy often depends on external verification, a pure SQL query is not always sufficient. This pseudocode shows the logic for validating a physical address.
# Synthetic Example
accurate_records = 0
total_records = 0

for record in database_table:
  total_records += 1
  # Assumes an external service or reference table to verify addresses
  if is_address_valid(record.street_address, record.zip_code):
    accurate_records += 1

accuracy_percentage = (accurate_records / total_records) * 100
print(f"Address Accuracy: {accuracy_percentage}%")
3. Uniqueness
Uniqueness is about eliminating duplicates where they do not belong. For a column that is supposed to be a unique identifier (like a customer ID), every value must be distinct.
Formula: A simple check is to compare the count of distinct values against the total row count. If they match, the data is unique.
SQL Example:
This query checks for duplicate customer_id values. It returns True if every ID is unique and False if it finds duplicates.
SELECT
  COUNT(DISTINCT customer_id) = COUNT(customer_id) AS is_unique
FROM
  orders;
4. Consistency
Consistency means data agrees with itself across different systems. A product’s price should be identical in your e-commerce store, inventory system, and billing platform.
Formula:
(Number of Matching Records / Total Records in Source A) * 100
SQL Example:
This query cross-references prices between an ecommerce_products table and a billing_system table, joined by a product_sku.
SELECT
  SUM(CASE WHEN e.price = b.price THEN 1 ELSE 0 END) * 100.0 / COUNT(e.product_sku) AS price_consistency_percentage
FROM
  ecommerce_products e
JOIN
  billing_system b ON e.product_sku = b.product_sku;
5. Timeliness
Timeliness measures the lag between a real-world event and its data becoming available for use.
Formula:
Data Availability Timestamp - Event Timestamp = Latency
An SLA would define the maximum acceptable latency. For example, logistics data for a package scan must be available in the system within 15 minutes.
SQL Example:
This query calculates the average latency in minutes between an order being placed (event_timestamp) and its record appearing in the analytics database (load_timestamp).
SELECT
  AVG(TIMESTAMPDIFF(MINUTE, event_timestamp, load_timestamp)) AS average_latency_minutes
FROM
  shipping_events;
Turning Metrics into Business Rules These calculations are building blocks. Their power comes when you connect them to clear business thresholds and SLAs. For instance, a timeliness SLA might state that "99% of all transaction data must have a latency of less than 5 minutes." This transforms a technical metric into a business promise.
6. Validity
Validity confirms that data follows the rules. Does an email address look like an email address? Is a phone number in the correct format?
Formula:
(Number of Valid Records / Total Number of Records) * 100
SQL Example:
This query uses a regular expression to check how many entries in the email_address column of a users table conform to a standard email format.
SELECT
  SUM(CASE WHEN email_address ~ '^[A-Za-z0-9._%+-]+@[A-Za-z0-9.-]+\.[A-Za-z]{2,}$' THEN 1 ELSE 0 END) * 100.0 / COUNT(*) AS email_validity_percentage
FROM
  users;
By systematically applying these data quality metrics, your organization can create a quantitative picture of its data health. This foundation is non-negotiable for building reliable systems. You can learn more about evaluating your organization's readiness by reviewing our guide to a successful AI readiness assessment.
Building Your Data Quality Monitoring Framework
Calculating data quality metrics is not useful if you do not act on them. To safeguard AI and analytics, you must move beyond one-off checks and build a monitoring system. This involves creating a framework that tracks trends, sends alerts when issues arise, and ensures someone is responsible for fixing them.
A solid monitoring framework elevates data quality from a technical chore to a critical business function. It gives your teams the ability to spot data decay before it affects a production AI model.

This is how you bridge the gap between measurement and management, connecting technical metrics to business control and accountability.
Visualizing Health with Data Quality Dashboards
You cannot manage what you cannot see. The first step is to bring data quality metrics to life with a dedicated dashboard. This is your command center for data health, showing how important metrics perform over time.
An effective dashboard should let you:
- Track Trends: Watch how metrics like completeness or accuracy fluctuate. A slow decline can be the first warning sign of a problem.
- Drill Down into Issues: When a metric suddenly drops, you need to be able to click in and see which data source or pipeline is the culprit.
- Monitor SLAs: Keep a visual scorecard of performance against targets, like maintaining 99.5% accuracy for customer financial records.
Imagine a logistics company's dashboard showing that data timeliness has increased from a 5-minute average latency to 45 minutes. That visual cue is an immediate call to action before the delay cripples a route optimization AI.
Setting Up Proactive Alerting Strategies
Dashboards are useful, but you cannot have someone watching them 24/7. Proactive, automated alerts turn your monitoring system from a passive reporting tool into an active defense mechanism.
You can create rules-based alerts that trigger notifications for specific events:
- A metric falls below a threshold (e.g., completeness drops below 95%).
- An unexpected anomaly occurs (e.g., a 50% jump in null values overnight).
- Data latency exceeds its SLA (e.g., inventory data is more than 15 minutes old).
A Practical Alerting Scenario An e-commerce company sets an alert on its
product_catalogtable. The rule: if the uniqueness metric forproduct_skufalls below 100%, an immediate alert is sent to the Data Steward. When a bug in a data pipeline creates duplicate SKUs, the alert fires instantly, allowing the team to fix the issue before it causes major inventory and sales reporting errors.
Establishing Clear Roles and Responsibilities
Tools and dashboards are only part of the solution. You need a human layer—a governance structure that assigns clear ownership and makes it obvious who must act when an alert fires.
Here are the key roles:
- Data Owner: An executive sponsor, such as a senior business leader, who is accountable for the quality of a data domain (e.g., the VP of Sales owns customer data).
- Data Steward: A hands-on expert responsible for the day-to-day management of data quality, defining rules, investigating alerts, and coordinating fixes.
- Data Custodian: An IT role focused on the infrastructure, ensuring data is stored correctly, backed up, and secure.
This structure eliminates finger-pointing. When a dashboard flags poor data quality metrics, the Data Steward knows it is their job to address it, and they have the backing of the Data Owner.
Putting this all together is a challenge. 64% of data professionals name data quality as their top challenge, and 49% say a lack of automated tools is a major roadblock, according to an internal survey of 200 data leaders in 2023. The best data pipeline orchestration systems build these monitoring principles directly into the workflow, making data quality a built-in feature.
Data Quality Metrics Delivering Real-World ROI
SQL queries and theoretical frameworks are not meaningful until they connect to business results. Managing data quality can improve revenue, efficiency, and risk.
Let’s review a few scenarios. While the companies are synthetic, the problems are common. These examples show how different industries use specific data quality dimensions to solve high-stakes problems.

Each of these stories connects a business challenge to the specific metrics that helped solve it. This is how data quality becomes a strategic driver.
Maritime Logistics: Slashing Fuel Costs
A global shipping firm invested in an AI model to optimize vessel routes and reduce fuel consumption. The projected savings did not materialize.
- The Business Problem: The AI was not delivering. The team found that the data feeding the model—live vessel telemetry and third-party weather feeds—was often stale or incorrect.
- The Key Metrics: The data team focused on Timeliness and Accuracy. They set an SLA that weather data could not be more than 15 minutes old. They also required 98% accuracy for vessel GPS coordinates, cross-checking it with a secondary tracking system.
- The Outcome: By building a dashboard that tracked these SLAs, the team could spot and fix pipeline delays and ingestion errors. With reliable data, the AI model started making better recommendations, leading to a 12% reduction in fuel consumption across the fleet compared to the previous quarter's baseline.
Retail: Boosting Sales with Clean Inventory Data
A major retailer was losing money. Popular items were often out of stock, while other products gathered dust. Their inventory forecasting AI was ineffective because the product data was inconsistent.
- The Business Problem: The root cause was their master product catalog. The same product existed under multiple, slightly different SKUs, confusing the forecasting models.
- The Key Metrics: The effort shifted to Uniqueness and Validity. The new mandate was a 100% uniqueness rate for every product SKU. Additionally, 99.9% of all product dimension data had to conform to a standardized format.
- The Outcome: They rolled out automated scripts to flag duplicate SKUs and invalid data. After a three-month cleanup, the forecasting AI had the clean data it needed. The result was an 8% increase in quarterly sales, driven by better product availability.
Data quality's impact extends beyond internal operations. Clean, reliable data is the only way to accurately measure customer experience. It is the foundation for understanding what your customers are thinking and doing.
Healthcare: Protecting Patients with Complete Data
A hospital system developed a predictive model to flag patients at high risk of a sudden decline. The model had to be reliable, as a single failure could have serious consequences.
- The Business Problem: The model depended on a constant stream of data from bedside vital sign monitors. Intermittent network drops and sensor glitches were creating dangerous gaps in the data, making the model's predictions unreliable.
- The Key Metric: For this use case, everything depended on Completeness. The clinical data science team set an SLA: vital sign data for any high-risk patient had to maintain 99.5% completeness over every five-minute window.
- The Outcome: They connected an alerting system that would immediately notify IT and clinical engineers the second any patient's data stream dropped below the 99.5% threshold. This proactive monitoring meant data gaps were fixed instantly, preserving the model's integrity.
Wrapping It All Up: From Data Quality to AI You Can Trust
Achieving enterprise-scale data quality is a continuous discipline. The journey from understanding core data quality metrics to building a robust governance framework is the only way to build reliable AI systems. It requires systematic measurement and control.
The challenges are real, but they are solvable. The key is to embed data quality into operations, not treat AI as a series of isolated experiments. When you do that, every AI initiative starts on a solid foundation of reliability and can deliver business value.
The path to production-grade AI is paved with systematic measurement and control. This is what turns data from a potential liability into a strategic asset that drives consistent business outcomes.
For leaders who are ready to achieve production-grade results, having the right platform can make a difference. To see how you can enforce these data quality standards and ensure AI reliability, you can explore solutions like DSG.AI's assureIQ. It is built to provide the comprehensive data validation and governance that enterprise systems demand. Adopting a strategic approach like this builds confidence and ensures your AI investments are built to last.
Common Questions on Data Quality Metrics
When starting a new data quality initiative, practical questions often arise. Here are some of the most common ones we hear from data leaders and our answers.
Where Do We Even Begin with a Data Quality Initiative?
The scope can feel overwhelming. Avoid trying to fix everything at once. Aim for a quick, tangible win.
- Start small and focused. Pinpoint one critical dataset, like your core customer table or main product catalog.
- Pick 2-3 key metrics. Focus on the most obvious problems for that dataset. For a customer table, this might be the completeness of email addresses or the uniqueness of customer IDs.
- Get a baseline and show improvement. Measure where you are today, implement a targeted fix, and show the "before and after." Demonstrating improvement builds momentum and proves the value of the project.
How Do We Get Business Stakeholders to Care?
Stakeholders care about business impact, not technical jargon. Frame the conversation around the bottom line.
Do not say, "Our data accuracy is low." Instead, say, "Last quarter, inaccurate shipping addresses cost us $250,000 in failed deliveries." When you tie poor data quality directly to lost revenue or compliance risks, you get their attention.
Can We Just Automate All of This?
Automation is a significant help, but it is not a complete solution. You still need human expertise.
While tools can automate tasks like detecting anomalies and monitoring SLAs, they cannot define what "good" means for your business. People set the rules, investigate edge cases, and fix the root causes of data issues.
Automation can tell you what is broken, but human governance is needed to understand and address why it broke.
At DSG.AI, we specialize in building the solid data foundations that enterprises need to succeed with production-grade AI. We transform data from a liability into a competitive advantage by creating systems that deliver clear business value. Learn how we tackle complex data projects.