
Written by:
Editorial Team
Editorial Team
The accuracy of a forecast starts with the quality of its data. Clean, well-structured data is the primary factor in reducing prediction errors. A 5% improvement in data integrity can often reduce forecast errors by 15-20%, based on common outcomes in data science projects.
1. Build a Resilient Data Foundation

It is tempting to test complex models like LSTMs or Gradient Boosting on raw data, hoping the algorithm will find signals. This approach often fails. The path to a better forecast begins with the raw materials.
A strong data foundation is not about having a massive data lake. It is about creating a unified, analysis-ready dataset that reflects business operations. This means breaking down data silos. A forecasting model needs a complete view, which requires integrating different data sources into a single structure.
At a minimum, you should unify:
- Customer Relationship Management (CRM): The source for deal stages, opportunity values, and sales cycle lengths.
- Enterprise Resource Planning (ERP): Where historical sales data, inventory levels, and supply chain information reside.
- External Market Data: Economic indicators, competitor pricing, and industry-wide trends.
When these sources are connected, they create a richer context. For example, connecting CRM pipeline data with ERP inventory levels can help predict stockouts. This is a blind spot when data remains separate.
Master Data Cleansing and Imputation
Once the data is integrated, it must be cleaned. Inaccurate forecasts often result from a "garbage in, garbage out" problem. Missing values, outliers, and inconsistencies are common in time-series data.
The method for handling missing values is important. Simply using the mean can flatten seasonal patterns and mislead the model.
For time-series data, methods like forward-fill, backward-fill, or interpolation are preferable to simple mean imputation. These techniques respect the temporal sequence of the data, which is critical for identifying trends and seasonality.
Outlier detection is also important. A single data entry error, like an extra zero on a sales order, can disrupt an entire forecast. Use statistical methods like Z-scores or the Interquartile Range (IQR) to find and manage these anomalies before they reach the model.
Unlock Predictive Power with Feature Engineering
With a clean, unified dataset, you can begin feature engineering. This is the process of translating business knowledge into a format a machine can understand. It involves creating new input variables (features) from existing data to help the model identify patterns.
Effective feature engineering uses more than just raw data points; it creates meaningful signals.
Consider a synthetic example: a retail company forecasting daily foot traffic. Instead of just using a date stamp, they could engineer more powerful features:
- Lag Features: Create features for foot traffic from the previous day, the same day last week, and the same day last year. This helps the model capture daily, weekly, and annual seasonality. A feature like
traffic_lag_7would represent the traffic from exactly one week prior. - Rolling Aggregates: Calculate a
7_day_rolling_averageof foot traffic. This action smooths out daily noise and helps the model see the underlying trend more clearly. - Interaction Terms: Combine weather data with marketing promotions. An interaction feature like
is_raining * marketing_spendcould help the model learn that promotional spending is less effective during rain.
This process transforms raw inputs into intelligent signals. By focusing on integration, cleansing, and feature engineering, you build a foundation that makes every subsequent step in the forecasting process more effective.
Select the Right Forecasting Models

Once your data is clean and your features are defined, it is time to choose the forecasting model. This is not about selecting the most complex algorithm. The goal is to match the right tool to the specific business problem and data characteristics.
Sophisticated neural networks can perform poorly on simple time-series data where a classic statistical model would have been effective. Before selecting a model, it is useful to review the strategic goals by understanding what financial forecasting entails. This ensures your model choice serves the business objective.
Comparing Model Families
Different models are designed to capture specific kinds of patterns. Their strengths and weaknesses vary. Starting with a simple baseline model provides a benchmark for performance.
-
Statistical Models (ARIMA, Exponential Smoothing): These models are effective for datasets with clear trends and seasonality but few external drivers. They are computationally light, interpretable, and suitable for forecasting monthly sales of a mature product with predictable seasonal patterns.
-
Machine Learning Models (Gradient Boosting, Random Forest): These models handle complexity well. When a forecast depends on non-linear relationships—such as competitor pricing, marketing spend, and economic indicators—ML models like XGBoost are appropriate. They can manage hundreds of variables to predict outcomes like retail foot traffic, considering weather, local events, and promotions.
-
Deep Learning Models (LSTMs, Transformers): These are specialized models for highly complex sequential data, such as high-frequency trading or intricate supply chain logistics. A Long Short-Term Memory (LSTM) network, for example, is designed to remember long-range dependencies that simpler models would miss.
The Power of Model Ensembling
Using multiple models can improve accuracy. The most resilient forecasting systems often use model ensembling. This technique combines predictions from several different models to produce a single, more accurate forecast.
A single model might be good at capturing seasonality but poor at reacting to a sudden market change. By combining it with another model that excels at identifying non-linear trends, the ensemble forecast becomes more robust and less prone to large errors.
Two common ensembling approaches are effective:
- Blending: The simplest method. It involves averaging the predictions of several models. For instance, you can take the output from an ARIMA and a Gradient Boosting model and calculate the mean.
- Stacking: A more advanced technique. A "meta-model" is trained to make a final prediction using the outputs of other base models as its inputs. This allows the system to learn which models to trust most under different conditions.
One multinational sales organization provides an example of these methods' impact. Over a six-month period, they improved their forecasting process. They started at 67% accuracy. By implementing weekly pipeline cleaning and AI-powered forecasting, they reached 94% accuracy. This resulted in a 22% increase in resource allocation efficiency and a 15% reduction in their sales cycle length, according to their internal project report.
The choice of models and ensembling strategies depends on your specific needs and data maturity.
Establish Continuous Improvement Loops
A forecast is not a static report. The most accurate forecasting systems are dynamic processes that constantly learn and adapt. Many organizations build a model, deploy it, and then ignore it until the predictions become inaccurate.
To improve, you must move beyond a reactive "fix-it-when-it-breaks" mindset. A forecast is never truly "done." The goal is to create a rhythm of tracking, analyzing, and retraining. This process catches performance decline before it becomes a problem and uncovers opportunities for improvement.
Systematically Track Predictions Against Actuals
You cannot improve what you do not measure. This starts with a disciplined, automated process for comparing model predictions against actual outcomes.
It is important to focus on a few core metrics to get a comprehensive view.
- Mean Absolute Error (MAE): This metric provides the average error in simple terms. An MAE of 150 means the forecast is off by an average of 150 units.
- Mean Absolute Percentage Error (MAPE): This metric is intuitive for non-technical stakeholders. A statement like "our demand forecast is 92% accurate" communicates performance clearly.
- Root Mean Square Error (RMSE): This metric penalizes large errors more heavily than small ones. If a major stockout would be catastrophic, monitoring RMSE is necessary.
The table below describes these key metrics to help you decide which are most relevant for your operational goals.
Key Metrics for Measuring Forecasting Accuracy
| Metric | What It Measures | Best For | Example Application |
|---|---|---|---|
| MAE | The average absolute difference between predicted and actual values. | Situations where the cost of an error is consistent, regardless of size. | Forecasting weekly call center volume, where being off by 100 calls has a similar operational impact each time. |
| MAPE | The average absolute error expressed as a percentage of the actual value. | Communicating accuracy to a broad audience and comparing forecast performance across products with different scales. | Reporting on inventory forecast accuracy for a portfolio of thousands of SKUs, from high-volume to low-volume items. |
| RMSE | The square root of the average of squared differences between prediction and actual. | Scenarios where large errors are disproportionately more costly than small ones. | Predicting electricity demand, where a large underestimation could lead to brownouts and financial penalties. |
Choosing the right metric depends on your business context. If all errors have a similar cost, MAE is a solid choice. If large errors are more concerning, RMSE provides a better signal.
The key is not just calculating these numbers, but automating the entire process. Your MLOps pipeline should be set up to pull in actuals as they become available and instantly generate an accuracy report. This turns a manual quarterly review into a continuous performance check.
Identify and Correct Systemic Biases
Once you have automated tracking in place, you can look for patterns in your errors. When a model is consistently wrong in the same way, it indicates a gap in its understanding of the business.
One large CPG company experienced this. Their demand forecast was consistently too low in the two weeks before major holidays. By tracking MAPE on a rolling basis, they saw the pattern was predictable, not random.
Upon investigation, they realized their model was missing the impact of their holiday promotions. The solution was to add new features for promotional spend and discount depth for those specific time windows. This adjustment reduced their holiday-season forecast error by 18% and prevented major stockouts on important products, as detailed in their post-implementation analysis.
This is an example of the feedback loop in action. In a separate case documented in a 2022 industry report, a similar approach led to a 20% reduction in forecast errors, which in turn cut stockouts by 15% and improved inventory turnover. You can discover more insights about the role of historical data in forecasting on eoxs.com.
Automate the Retraining and Deployment Cycle
Identifying a bias is only the first step. You must be able to act on that insight quickly. This requires a mature approach to MLOps, specifically CI/CD for machine learning.
Your systems should make retraining and redeploying a model a seamless event. This means versioning everything: your code, your data, and your models. When you identify an opportunity for improvement, you need the ability to test, validate, and deploy the updated model without disrupting the system.
A robust workflow orchestration platform is the backbone for managing these complex dependencies and ensuring a repeatable process.
By building these feedback loops—from automated monitoring and bias detection to a streamlined retraining pipeline—you transform your forecasting system from a static tool into an asset that becomes more accurate with each prediction cycle.
Operationalize Forecasts with MLOps
A perfectly tuned forecasting model is a good technical achievement. An operationalized forecasting model is a business asset. The most common point of failure in enterprise AI is often the fragile, manual process between the data science environment and real-world business operations.
This is where Machine Learning Operations (MLOps) is necessary. MLOps provides the framework, automation, and governance needed to deploy, monitor, and manage forecasting models reliably at scale. It turns forecasting from a one-off project into a continuous, automated business process. Without this operational backbone, even the best models will degrade, delivering diminishing returns and creating business risk.
Build a Scalable Deployment Pipeline
Moving a model from a data scientist's laptop into a production environment requires a solid, repeatable process. Ad-hoc deployments are slow, prone to errors, and do not scale. A modern MLOps pipeline for forecasting needs several key components.
- Containerization: The first step is to package your model, its dependencies, and all necessary code into a container (like Docker). This ensures the model runs consistently in all environments.
- Version Control: This applies to more than just code. You must version everything: your models, the specific datasets used for training, and your feature engineering scripts. This discipline creates a full audit trail, making it possible to roll back to a previous version or reproduce a specific forecast later.
- Automated Testing: Before any new model version is deployed, it must pass a suite of automated tests. These should cover code quality, data validation, and prediction accuracy against a clean holdout dataset.
Following a framework like a Production Readiness Checklist helps ensure systems are reliable and ready for a live operational setting.
Monitor for Concept Drift and Data Skew
Once a model is live, its work is ongoing. The real world changes—customer behavior shifts, market conditions evolve, and supply chains are disrupted. This phenomenon, known as concept drift, occurs when the statistical properties of the target variable change over time. When that happens, an accurate model can become unreliable.
A model trained on pre-2020 sales data does not account for pandemic-era supply chain disruptions. Without active monitoring, its forecasts will become progressively worse as it applies old patterns to a new reality. This silent degradation is a significant source of forecasting error.
Automated monitoring is the first line of defense. Your MLOps platform should continuously track not just the model's accuracy (MAE, MAPE), but also the statistical distributions of the input data. If the incoming data starts to look fundamentally different from the training data—a condition called data skew—the system should generate an alert. This is a signal to investigate and likely retrain the model.
This simple cycle is core to maintaining high forecasting accuracy: track performance, analyze for drift, and retrain the model.
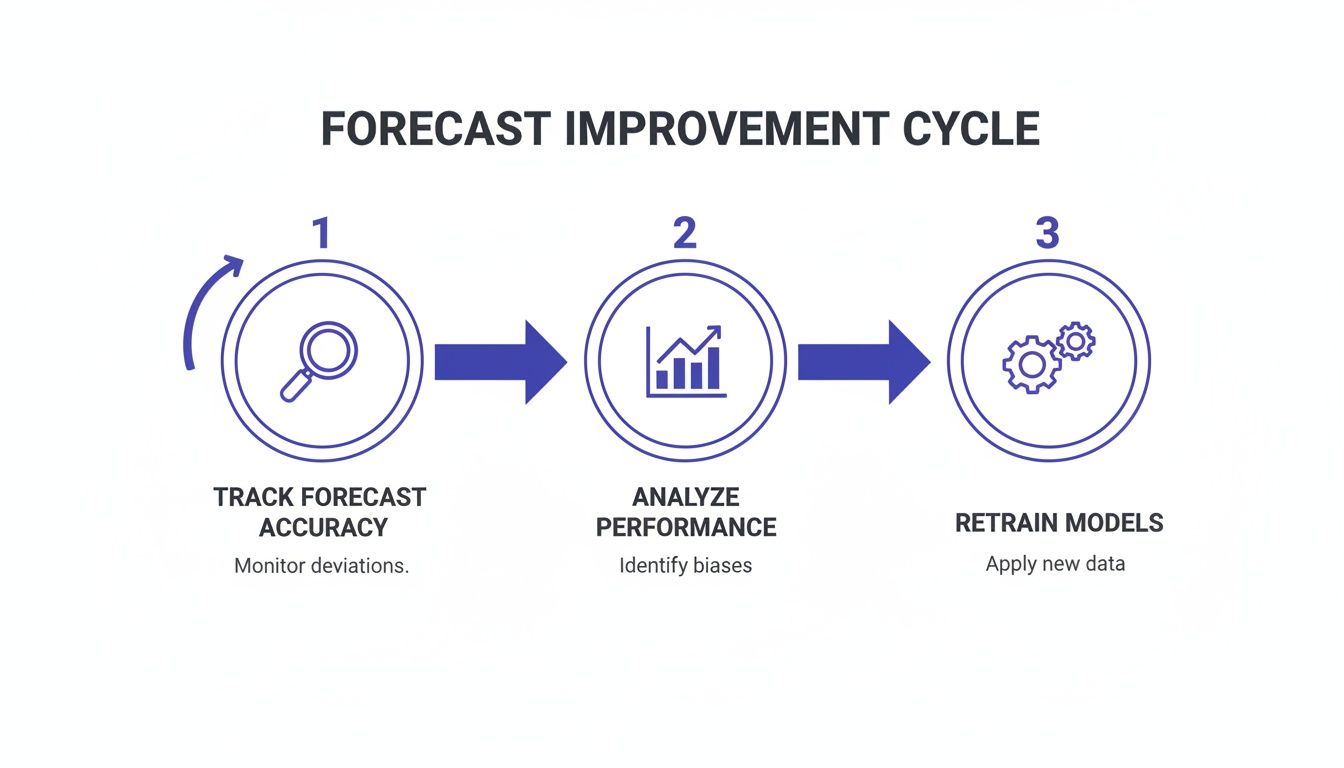
This constant loop ensures your forecasting system adapts to changing business conditions instead of becoming a static liability.
Ensure Governance and Explainability
For a forecast to be trusted and used by the business, it cannot be a black box. Governance and explainability are essential for building confidence and ensuring models align with business objectives. Techniques from Explainable AI (XAI), like SHAP (SHapley Additive exPlanations), can show which features are driving a particular forecast.
This transparency makes a model more useful. If a model predicts a 30% drop in demand, stakeholders will ask why. XAI can provide the answer. You can show that the drop is linked to a spike in competitor promotions and a dip in a key economic indicator. This builds trust and allows for more informed decision-making.
Specialized tools for AI governance and monitoring are becoming central to managing these capabilities. They help ensure your forecasting systems are transparent, auditable, and aligned with enterprise standards.
Marry Human Expertise with Your AI
Your AI model can process historical data at a large scale, but it has a blind spot: it only knows what has already happened.
An AI does not know about a competitor’s new product launch next quarter, a planned marketing campaign, or a supply chain disruption your procurement team is already addressing. This is where human experts are valuable.
The most accurate forecasting systems are often hybrid systems, blending machine intelligence with the insights of human experts. This approach creates a process that is both data-driven and business-aware, avoiding the "black box" problem where models produce numbers without real-world context.
By creating structured pathways for your experts to provide qualitative knowledge, you give the model critical context for making smarter predictions. This helps it avoid being surprised by events that do not exist in the training data.
Build Human-in-the-Loop Workflows
One effective method is to use human-in-the-loop (HITL) workflows. Instead of having your team accept every number the model generates, you build a system that flags specific forecasts for expert review. This focuses your team's attention where it is needed most.
You can set up your HITL system to trigger a manual review based on specific rules:
- Low Confidence Scores: The model flags any forecast where its confidence drops below a set threshold, for example, 85%.
- High Volatility: Predictions for products or regions with a history of being difficult to predict are automatically sent for human approval.
- Significant Deviations: If a forecast suddenly changes by more than 20% compared to the historical average or a baseline model, it is sent to an expert for review.
For example, a model predicts a 40% drop in demand for a flagship product. An HITL workflow would instantly notify the relevant category manager. The manager can then assess whether the drop is due to a known event, like a competitor's promotion, or if it is a statistical anomaly that should be overridden.
This process is not about micromanaging the machine. It is about creating a system of checks and balances. You get the benefits of the AI’s data processing power and your team’s ability to interpret context and strategy.
Create a Structured Feedback Loop
For human input to be an asset, it must be structured and documented. Ad-hoc adjustments on a spreadsheet can introduce noise and bias. The goal is to capture expert knowledge in a way that can be systematically fed back into the forecasting process.
This feedback should make your models more accurate over time.
This means creating clear channels for your domain experts to provide forecast overrides and document their reasoning. For example, a supply chain planner might increase a forecast by 15% for the next quarter. They should not just change the number; they should add a note: "new contract secured with major distributor." That override and its reason become labeled data for the next model iteration.
Keeping detailed records and refining your approach can help address forecast bias and improve accuracy. One retailer built a scorecard to track forecast errors back to their root causes. By consistently using expert feedback to update their model's assumptions, they reduced their error rate by 20% over 12 months.
To see how you can structure these improvements, you can explore forecast scorecard frameworks on businessinitiative.org. By incorporating human expertise into your process in a disciplined way, you build a forecasting system that not only predicts the future more accurately but also learns from the knowledge within your organization.
Common Questions on Forecasting Accuracy
Leaders often have practical questions about implementation. Getting clear answers is key to setting realistic goals and managing stakeholder expectations. Here are a few common questions.
What’s a Realistic Accuracy Improvement to Expect?
If you are moving from manual spreadsheets or simple historical averages to a machine learning approach, a 15-30% improvement in forecast accuracy in the first six months is a reasonable target. This outcome is common across different industries when teams commit to a disciplined, data-first process.
The exact gain depends on your starting point:
- Industry & Volatility: A consumer packaged goods company forecasting demand for steady-selling products will likely see gains on the higher end of that range. Forecasting volatile commodity prices may result in a more modest improvement that is still valuable.
- Data Quality: The cleaner your historical data is, the faster you will see results. If your team must spend significant time on data cleansing, initial gains might be closer to 10-15% while that foundational work is completed.
After the initial improvement, you can expect an additional 5-10% in accuracy over the first year through continuous refinement and model iteration. Forecasting should be treated as an ongoing operational discipline, not a one-time project.
How Long Does It Take to Deploy an Enterprise Forecasting System?
Deploying a new forecasting system does not need to be a multi-year project. Modern MLOps practices and an iterative approach have shortened the timeline.
A focused project targeting a single, high-value use case—like forecasting demand for your top 20% of SKUs—can go from discovery to a production-ready model in as little as 6 to 8 weeks.
The key to this speed is focusing on the architecture first. Building a scalable foundation from day one allows you to deliver business value quickly and then expand the system's capabilities over time without starting over.
Should We Prioritize Data Quality or Model Complexity?
Prioritize data quality. A complex neural network will produce poor forecasts if fed noisy, incomplete, or biased data. It will become effective at finding meaningless patterns in bad information.
In contrast, a simpler statistical model running on clean, well-engineered data can produce accurate and trustworthy results. Your first investment should be in building a solid data pipeline. Once that is established, start with a simple baseline model. This provides a reliable benchmark to determine if adding more complex models later provides additional value.
At DSG.AI, we help enterprises get from strategy to production-ready AI in weeks, not years. Our architecture-first approach ensures your forecasting systems are scalable, reliable, and deliver measurable business value right away. See how we turn data into a competitive advantage by exploring our AI projects.