
Written by:
Editorial Team
Editorial Team
Reducing operational costs without a clear plan often leads to short-lived gains and unintended problems. Sustainable savings come from a structured framework that changes how your business manages expenses, not from random budget cuts.
This guide provides a repeatable, four-phase process for identifying, prioritizing, and implementing cost-saving initiatives. The goal is to build a foundation for long-term efficiency.
Your Framework for Strategic Cost Reduction
A methodical approach ensures you solve the right problems. It starts with a diagnostic to understand not just what is costing money, but why. From there, you prioritize opportunities based on their potential return on investment (ROI) and implementation difficulty. Only then do you deploy solutions, like redesigning a process or implementing new technology. The final step is establishing a governance model to sustain the gains.
To illustrate this, we will use a synthetic example throughout this guide: LogiCorp, a global logistics provider. We will follow them as they identify excessive fuel consumption and manual support tasks, then deploy an AI optimization engine that delivers measurable savings.
The Four Phases of Cost Reduction
A successful cost-reduction initiative follows a clear, repeatable lifecycle. This visual flow outlines the four core stages, moving from initial diagnosis to ongoing optimization.
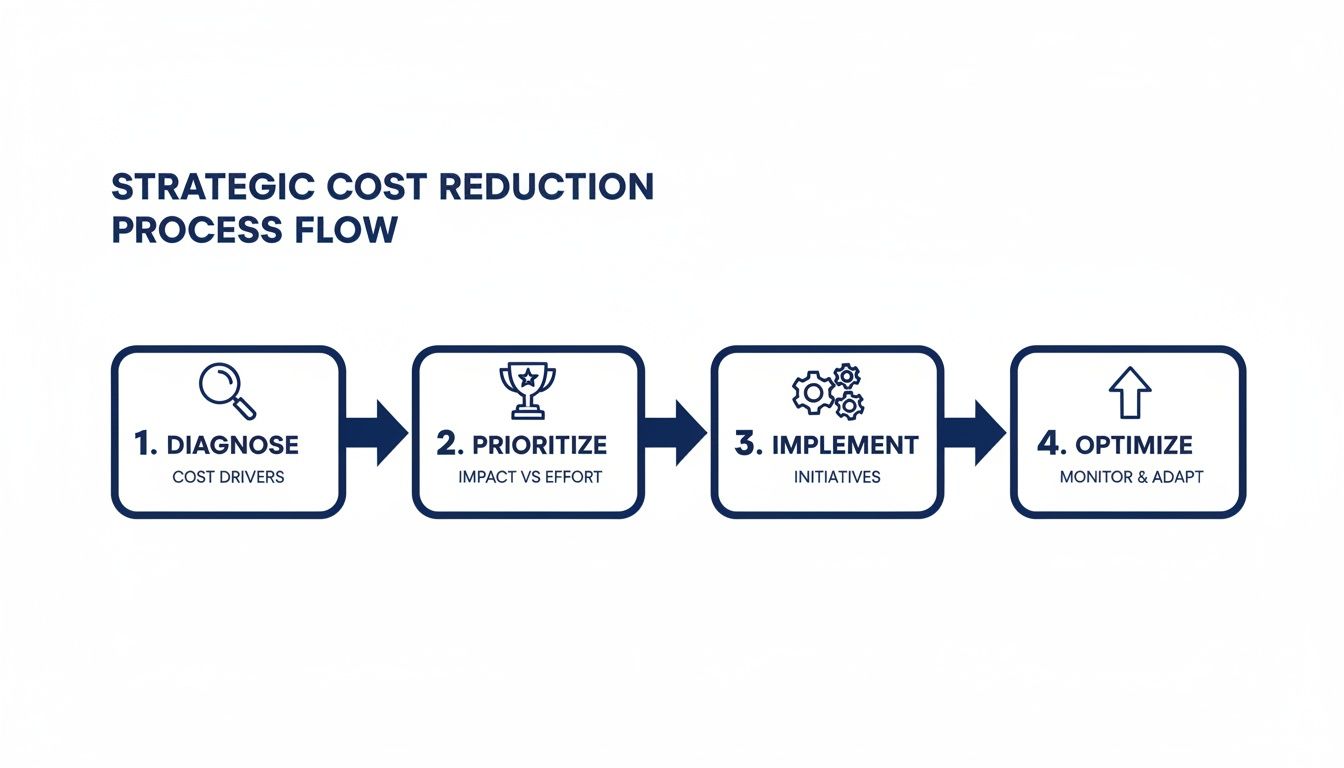
Following this process ensures every action is driven by data and focused on changes that create business value.
A common mistake is investing in new technology before fully understanding the process inefficiencies it’s supposed to fix. A disciplined framework prevents you from automating a broken process—which only helps you produce waste faster.
For a clearer picture, here’s a high-level overview of how these phases fit together.
Enterprise Cost Reduction Framework At a Glance
This table breaks down the entire lifecycle, showing what to do at each stage and what to expect.
| Phase | Objective | Key Activities | Expected Outcome |
|---|---|---|---|
| Diagnose | To identify and quantify the primary drivers of operational costs. | Data gathering, process mapping, stakeholder interviews, root cause analysis. | A data-backed list of cost drivers and a clear problem statement. |
| Prioritize | To select the highest-impact cost-saving opportunities. | ROI modeling, feasibility assessment, risk analysis, business case development. | A prioritized roadmap of initiatives with clear financial targets. |
| Implement | To execute the chosen initiatives and realize savings. | Process redesign, technology deployment (automation, AI/ML), change management. | Measurable cost reductions and improved operational efficiency. |
| Optimize | To sustain savings and foster a culture of continuous improvement. | KPI tracking, performance monitoring, governance establishment, playbook refinement. | A self-sustaining system for ongoing cost management and efficiency. |
Each phase builds on the last, creating a cycle of improvement that can deliver compounding returns.
Building a Foundation for Success
An effective framework is technology-agnostic but data-centric. It provides the structure needed to make informed decisions, whether optimizing a supply chain, streamlining back-office functions, or managing cloud spend.
For instance, teams managing large cloud infrastructures can find significant savings by adopting a structured approach, like following 10 essential AWS cost management best practices. This same disciplined thinking applies to any operational area.
The goal is to create a repeatable system that not only reduces costs but also builds a more resilient and efficient organization. In the next sections, we will break down each phase, starting with how to properly diagnose hidden cost drivers.
Finding Hidden Costs and Diagnosing Inefficiencies
To significantly reduce operational costs, looking at high-level expense reports is insufficient. True cost reduction requires a diagnostic mission to uncover the root causes of operational bloat—the friction points where time and money are lost daily.
The process involves moving past summary financials to examine the details of how work gets done.

The real culprits are often buried in undocumented workflows, outdated systems, and manual workarounds that have become institutional habits. These small inefficiencies compound over time, creating a large financial drag.
The first job is to make these invisible costs visible.
Start with Process and Value Stream Mapping
Process mapping helps visualize a workflow from beginning to end. By documenting every step, decision, and handoff in a process like vendor onboarding or order fulfillment, you can identify redundant tasks, bottlenecks, and manual interventions.
Value stream mapping adds another layer by examining each step from the customer's perspective to determine if it adds value. Manufacturing a product adds value. Storing it in a warehouse for a week does not. Many organizations find they spend significant resources on non-value-adding activities.
Here is a synthetic example: LogiCorp mapped its customer support process and found that 15% of all support tickets were repetitive queries about shipment status. This single issue consumed over 5,000 agent hours per month—a significant cost center that was not visible in their top-line support budget.
Audit Your Tech and Data Stack
Your technology stack can become a source of hidden costs as it accumulates outdated software, redundant applications, and disconnected systems. The result is friction and manual workarounds.
A technology audit should ask direct questions:
- Application Overlap: Are we paying for multiple software tools that perform the same function?
- Manual Data Entry: Where are teams spending hours copying data between systems?
- Underutilized Features: Are we paying for enterprise-tier software but using only 10% of its features?
This is not a theoretical exercise. According to public reports, the video platform Kaltura found it was running 10 different observability systems. By consolidating them into a single platform, the company reduced its related operational costs by 60%. A technical audit can expose such opportunities.
Build Your Cost Driver Map
The outcome of the diagnostic phase should be a Cost Driver Map. This is a visual blueprint that connects specific operational problems to their financial impact.
A Cost Driver Map transforms a vague problem like "our support team is inefficient" into a tangible opportunity: "we can save 5,000 hours of manual ticket handling per month through automation." This type of quantified data gets stakeholders' attention.
To build this map, you must quantify the financial impact of each problem. If you need help identifying automation and AI opportunities, a structured evaluation is a good first step. An analysis can reveal your organization's readiness and highlight promising use cases. To learn more about this process, you can evaluate your AI opportunities and start building a data-driven roadmap.
With this foundational work done, you are positioned for the next phase: prioritizing these opportunities to achieve the highest impact.
Prioritizing Your Opportunities and Building the Business Case
After mapping your cost drivers, you will have a list of potential projects. Attempting to address all of them at once dilutes focus and delays results.
Effective cost reduction requires prioritization. You need a straightforward method to identify initiatives that will deliver the most significant impact quickly. Not all opportunities are equal; some are large projects that take a year to implement, while others are quick wins that build momentum. The goal is to find the right balance.
A Practical Scoring Model
A scoring model helps move from a long list to a focused roadmap. This is not about creating a complex spreadsheet but about facilitating a data-driven conversation that removes subjective feelings from the decision.
Evaluate each potential project against a few core criteria. Here are three that are most important:
- Potential Cost Savings: What is the estimated annual savings? Quantify this in dollars or as a percentage. An 8 to 15 percent reduction in a specific area is a reasonable target for a single initiative.
- Implementation Complexity: How difficult will this be to implement? Consider the time, people, and technical hurdles involved. A simple 1 (easy) to 5 (very complex) scale is sufficient.
- Strategic Alignment: Does the project offer benefits beyond cost savings? An initiative that also improves customer satisfaction or reduces compliance risk is more valuable.
Scoring each project against these criteria will produce a ranked list, clarifying where to invest your time and capital for the best return.
Comparing Opportunities: A Synthetic Example
Let’s return to our synthetic example, LogiCorp. Their diagnostic work uncovered two major opportunities:
- Automate Low-Value Support Tickets: Use an AI agent to handle the 15% of support queries that are simple shipment status questions.
- Overhaul the CRM System: Replace their entire aging customer relationship management platform.
The CRM overhaul may seem more strategic. However, when run through the scoring model, the results were different.
| Initiative | Projected Annual Savings | Implementation Time | Priority Score (1-10) |
|---|---|---|---|
| AI Ticket Automation | $1.3 Million | 6 Weeks | 9 |
| CRM Overhaul | $2.5 Million | 18 Months | 4 |
The AI project could deliver $1.3 million in annual savings and be live in 6 weeks. The CRM overhaul, despite promising larger long-term savings, was an 18-month project with significant risk and a long wait for any ROI. The choice became clear.
Selecting a high-impact, low-complexity project first is a strategic advantage. It provides a quick, visible win that validates your methodology, builds credibility with leadership, and can generate the savings needed to fund larger projects later.
Crafting a Business Case That Gets Approved
With your top priority selected, the final step is building a business case for executive sign-off. This should be a clear, concise, and persuasive argument that focuses on financials, risk, and results.
Your pitch should include these key points:
- The Problem Statement: State the inefficiency and its cost directly (e.g., "We spend over 60,000 agent hours a year, at a cost of $1.3M, answering 'where is my package?'").
- The Proposed Solution: Describe the solution in simple business terms, focusing on the outcome.
- The Financials: Show the projected ROI, payback period, and total cost. Using conservative numbers builds trust.
- The Roadmap: Provide a high-level timeline with key milestones to show you have planned the execution.
- The Risks: Proactively address potential roadblocks (e.g., change management, data privacy) and explain your mitigation plan.
Presenting this level of detail demonstrates that you have not only found a way to reduce operational costs but have also charted a clear, low-risk path to achieve it.
Implementing Solutions with Process Redesign and AI
Once you have identified high-impact opportunities, it is time to execute. A common mistake is applying new technology to old, inefficient workflows. This approach automates existing problems, which can increase waste.
Significant reductions in operational costs come from rethinking how work is done. You must be willing to challenge existing assumptions and redesign processes for efficiency.

Before writing code or signing a vendor contract, map out the ideal future-state workflow. Only after you have a lean, optimized process should you consider how automation and AI can enhance it.
Matching Technology to the Task
With a redesigned process mapped out, you can select the right tools. Not all automation is the same.
Traditional, rules-based automation is suitable for simple, high-volume, repetitive tasks. For complex, data-heavy problems, AI and machine learning offer more advanced capabilities.
Here are a few synthetic examples:
- Predictive Maintenance: A global mining operation uses AI to analyze sensor data from its haul trucks. The model predicts equipment failures before they happen, allowing for proactive maintenance that prevents unplanned downtime, which can cost millions per incident.
- Demand Forecasting: A large retail chain uses AI models that analyze weather patterns, local events, and social media trends to predict demand with greater accuracy. This reduces both overstocking and stockouts.
- Procurement Automation: A financial services firm implements an AI-powered procurement system that analyzes contracts, identifies optimal pricing, and automates approval workflows, achieving a 50% reduction in the time required to finalize a contract.
According to a 2019 McKinsey analysis, the most significant gains do not come from isolated pilots. Leading companies see savings of up to 25% from comprehensive redesigns that integrate AI holistically, far exceeding the 5% gains typical of siloed experiments. This highlights the need for a strategic, architecture-first approach.
To better understand the distinction, consider how these two types of automation address common operational challenges. Traditional automation follows a script, while AI learns, adapts, and makes intelligent decisions.
Comparing AI and Traditional Automation for Cost Reduction
| Operational Area | Traditional Automation Approach | AI-Driven Approach | Potential Impact |
|---|---|---|---|
| Inventory Management | Sets fixed reorder points based on historical sales averages. | Analyzes real-time demand signals, seasonality, and external factors (e.g., weather) to dynamically adjust inventory levels. | 15-30% reduction in carrying costs and fewer stockouts. |
| Customer Support | Uses rule-based chatbots to answer simple, predefined FAQs. | Deploys conversational AI that understands intent, resolves complex issues, and personalizes interactions. | 40% reduction in call handling time and improved customer satisfaction. |
| Financial Reconciliation | Matches invoices to purchase orders based on exact data matches. | Uses natural language processing (NLP) to read unstructured invoices, identify discrepancies, and flag anomalies for review. | 70% reduction in manual reconciliation effort and improved accuracy. |
| Supply Chain Logistics | Follows static, pre-planned delivery routes. | Uses AI algorithms to optimize routes in real-time based on traffic, weather, and delivery priorities. | 10-20% reduction in fuel costs and improved on-time delivery rates. |
While both have their place, AI-driven solutions can unlock a different level of operational intelligence and efficiency.
The Power of an Architecture-First Approach
Deploying enterprise-grade AI requires a solid technical foundation. An architecture-first methodology ensures your solution is effective, scalable, reliable, and secure. This approach focuses on building a robust system that integrates with your existing technology stack.
A well-designed architecture also allows you to own your intellectual property (IP). This is a critical distinction from many off-the-shelf solutions that can lead to vendor lock-in and limit your ability to customize. Full ownership gives you control over the source code, allowing you to adapt the system as your business evolves.
This control is especially important in regulated industries. Effective AI governance—from monitoring model performance to ensuring compliance—is easier when you have complete command over the system.
Quantifying the Impact of AI in Finance
The financial services sector provides a clear view of AI's impact on operational costs. Across the banking industry, AI-driven transformations are projected to deliver a net 15-20% cost reduction, with some analyses suggesting this could climb to 30% as automation matures.
For example, public reports state that Fidelity Investments achieved a 20% savings in procurement and cut contract finalization times in half by using AI. These are not gains from small tests; they are the result of systematic, end-to-end integration. A 2023 report from Autonomous Research noted that one leading wealth manager is targeting $1 billion in annualized savings by adopting this holistic strategy. The results are consistent: a 2021 study by the Cambridge Centre for Alternative Finance found that 57% of AI leaders in finance report ROI that exceeds their initial expectations.
Departments like accounting are also seeing significant benefits. For example, specific AI in accounting solutions can automate administrative tasks, reduce error rates, and streamline reporting for cost savings. The principle is consistent: first redesign the process, then apply intelligent automation.
Measuring ROI and Driving Continuous Improvement
Launching a new AI solution or redesigned process is the beginning, not the end. The true test of a cost-reduction initiative is its ability to deliver sustained value. This requires a solid framework for measuring return on investment (ROI) and building a culture of continuous optimization.
If you are not measuring, you are not managing. Without clear metrics, early wins can disappear as old habits return.
Go Beyond Simple Cost Savings with the Right KPIs
While the goal is to reduce operational costs, focusing only on dollars can be misleading. True operational excellence appears in multiple ways. Your key performance indicators (KPIs) should provide a complete picture, capturing gains in efficiency, quality, and team performance.
These KPIs are effective for tracking impact:
- Process Cycle Time: How long does a workflow take from start to finish? A 20-30% reduction indicates that significant friction has been eliminated.
- Error Rate Reduction: What percentage of work results in defects or rework? This is a direct measure of quality improvement and a source of hidden costs.
- Employee Productivity Gains: How many hours of manual work have been automated? This KPI shows how you are freeing up your team for more strategic activities.
- Cost-Per-Interaction or Transaction: For high-volume work like customer support or invoice processing, what is the unit cost? This is a straightforward metric for quantifying ROI.
Tracking the Impact: A Synthetic Scenario
Let’s return to our synthetic example, LogiCorp. After implementing their AI agent for shipment status queries, they set up a dashboard to track its performance against the previous manual baseline.
Within the first quarter, the AI agent reduced the cost-per-interaction by 90%, from $5.50 with a human agent to $0.50 for an automated response. They also saw a 20% increase in customer satisfaction scores for these queries because customers received instant answers 24/7.
This multi-faceted approach to measurement is important. By tracking both financial and operational KPIs, LogiCorp could demonstrate to leadership that the project not only cut costs but also improved the customer experience.
The impact of AI on customer service is a clear example of cost reduction. For large enterprises, AI agents can drive 85-90% cost reductions compared to live agents. These systems can resolve queries for $0.25 to $0.50 per interaction, a fraction of the $3.00 to $6.00 cost for a human-led conversation. Many projects see a payback period of 4-6 months. You can find a complete analysis of AI vs. live agent costs for more details on how this is changing budgets.
Build a Governance Model for Continuous Improvement
Sustained success requires a formal governance structure. This is not about creating bureaucracy but about establishing a rhythm for review and refinement that keeps everyone focused on efficiency. A good governance model makes cost optimization an ongoing discipline.
An effective model usually includes these components:
- Quarterly Performance Reviews: A dedicated team should review performance dashboards each quarter to analyze trends, recognize successes, and identify any metrics that are not improving.
- A Feedback Loop for New Ideas: The people working in the new processes are the best source of intelligence. Create a formal channel for them to submit suggestions for improvements.
- Proactive Tech Scouting: The governance team should monitor new tools and techniques that could provide the next wave of savings.
This structured approach transforms cost management from a reactive exercise into a proactive, strategic function. It ensures the insights gained from one project are applied to the next.
If you are looking for a structured way to find your next high-impact project, a guided assessment can help. Consider getting a customized operational cost reduction audit to uncover your most promising opportunities.
Answering Key Questions on AI-Driven Cost Reduction
Using AI to reduce operational costs raises practical questions. Leaders want to understand the returns, the risks, and where to begin. Answering these questions is essential for building the confidence to approve an AI initiative.
What’s the Real ROI on an AI Cost Reduction Project?
The return on investment can be significant but depends on the problem being solved. For projects with well-defined goals and clear metrics, the payback can be very fast.
For high-volume, repetitive work like customer service automation, projects often pay for themselves within 4 to 6 months. It is common to see a 15% to 40% reduction in operational costs for that specific business function.
How Do We Handle AI Risks Like Compliance and Model Drift?
Managing AI risk must be part of the initial plan. The two main concerns are regulatory compliance and model drift, which is when an AI's performance degrades because the real-world data it processes no longer matches its training data.
A Responsible AI framework is necessary. This means implementing continuous monitoring tools to watch model accuracy, fairness, and output quality. This type of governance helps keep your systems effective and compliant with regulations like the EU AI Act.
Where Should We Start Our AI Journey for Cost Reduction?
The best first step is to choose a problem that is both high-impact and low-complexity. Your initial diagnostic work should identify a few good candidates. The goal is a quick, tangible win to build momentum and prove the concept.
Look for opportunities with these characteristics:
- Highly repetitive manual tasks that consume significant staff hours.
- Clear, data-driven decision points where human analysis is either too slow or inconsistent.
Successfully addressing one of these first demonstrates immediate value. This makes it easier to get buy-in for larger, more ambitious AI projects later.
At DSG.AI, we specialize in helping enterprises design, build, and run AI systems that deliver measurable value in just six weeks. We create a clear path to lower operational costs with solutions that are scalable, reliable, and entirely yours.
See our work and find out how we can help at https://www.dsg.ai/projects.