
Written by:
Editorial Team
Editorial Team
Deploying a machine learning model is the start, not the finish line. In a production environment, models confront data drift, concept drift, and unexpected inputs that can degrade performance, introduce bias, and create business risk. This silent erosion of model accuracy is a direct threat to operational stability.
This guide evaluates leading machine learning model monitoring tools. We provide a comparative analysis of 12 solutions, assessing features for enterprise scale, governance, and sustained value. The goal is to educate MLOps leads on available platforms to move from reactive failure response to proactive AI assurance.
Inside, you will find a detailed breakdown of each tool, including:
- Key Features: Capabilities for detecting drift, performance degradation, and data quality issues.
- Deployment & Integration: Analysis of cloud, on-premise, and hybrid options, plus compatibility with existing MLOps stacks.
- Governance Support: Assessment of features supporting compliance with regulations like the EU AI Act.
- Ideal Use Cases: Guidance on which tool best fits specific operational needs, from fraud detection to supply chain optimization.
Each review includes direct links to the platform and relevant screenshots to help you make an informed decision.
1. ManageAI Platform — AI Performance Monitoring (DSG.AI)
For enterprise organizations requiring a scalable and governance-focused solution, DSG.AI's ManageAI Platform is a comprehensive choice among machine learning model monitoring tools. It is engineered to provide oversight across the AI lifecycle, moving beyond simple performance metrics to address operational, risk, and compliance challenges. The platform's architecture-first approach ensures it integrates into complex MLOps and IT ecosystems without imposing rigid technology constraints.
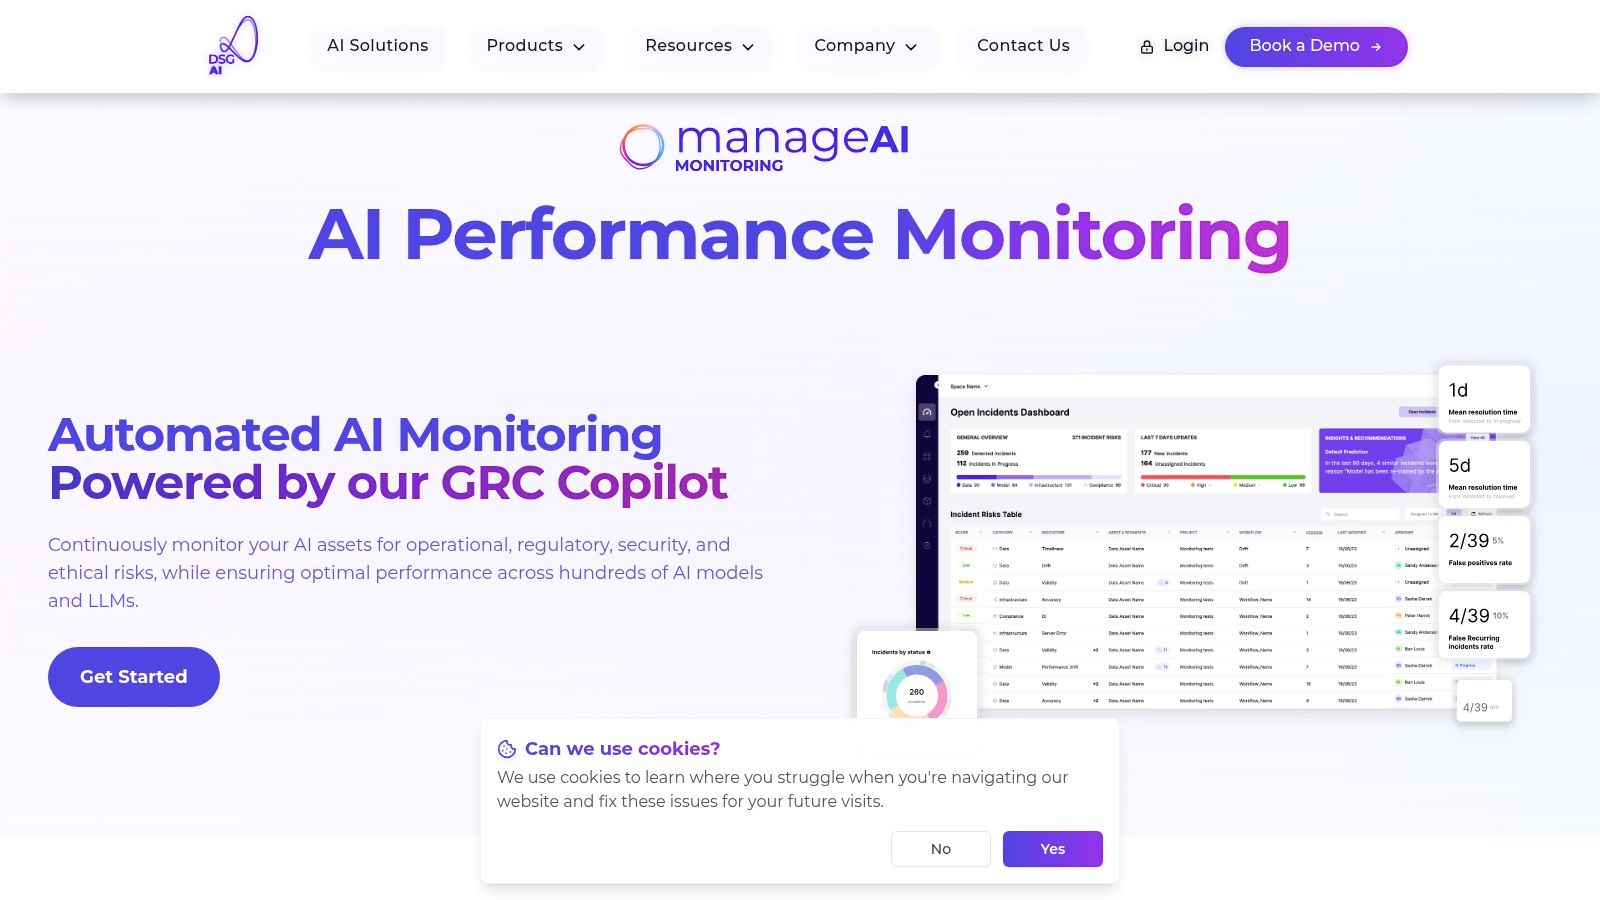
ManageAI offers full IP ownership and source-code control, an advantage for enterprises in regulated industries. This approach counters vendor lock-in, empowering internal teams with control and customization capabilities. Its stated six-week implementation provides a structured path to value, ensuring that monitoring capabilities contribute to business outcomes.
Key Capabilities and Use Cases
The platform's strength lies in its library of over 50 configurable monitors. These provide visibility into model performance, data quality, security vulnerabilities, and compliance gaps.
- Real-Time Anomaly Detection: (Synthetic Example) A financial services firm can use ManageAI to monitor a credit risk model in real time. If the tool detects data drift caused by macroeconomic shifts, it alerts teams. This allows for model recalibration, preventing an increase in faulty loan approvals.
- Regulatory Readiness (EU AI Act): (Synthetic Example) A healthcare provider using an AI diagnostic tool can use ManageAI's governance features to generate automated audit trails. This prepares them for regulatory scrutiny by demonstrating model fairness, transparency, and data integrity.
- Operational Optimization: (Synthetic Example) The platform monitors a demand-forecasting model for a logistics company. It detects performance degradation and feeds optimization insights back to the operations team to adjust inventory levels.
Implementation and Suitability
ManageAI is suited for mature organizations with multiple models in production or those scaling their AI initiatives and requiring centralized governance. The comprehensive nature of the platform means initial setup requires dedicated MLOps and governance personnel to configure monitors and integrate alerting into existing workflows. Its enterprise-grade design is an asset for organizations needing scalable and fully-owned AI oversight.
Best For: Enterprise CIOs, Heads of AI, and GRC executives who need a scalable, technology-agnostic monitoring solution with full IP control and built-in support for regulatory compliance.
Website: https://www.dsg.ai/manageai
2. Arize AI
Arize AI is an ML observability platform designed to help teams detect issues, troubleshoot root causes, and improve model performance. It offers a fully-managed SaaS solution and an open-source component, Arize Phoenix, catering to a range of organizational needs.
This dual-offering approach allows data science teams to start with Phoenix for local model evaluation and tracing, then transition to the cloud platform for production monitoring without changing core instrumentation. The platform supports both traditional ML and LLM-based systems, offering features like token/cost tracking and multi-modal model support.
Key Features and Implementation
- Deployment Model: SaaS (cloud-hosted) or self-hosted via the open-source Arize Phoenix component.
- Core Capabilities: Provides online and offline model evaluations, customizable monitoring dashboards, and tracing with OpenTelemetry support for dissecting model predictions.
- Use-Case Suitability: Useful for teams developing and deploying both traditional ML and Large Language Models (LLMs), particularly those needing to debug model behavior in pre-production and monitor performance drift, data quality, and LLM-specific metrics in production.
- Integration: Integrates with a wide ecosystem of MLOps tools and frameworks.
The ability to run offline evaluations and then compare them directly against online production data within the same tool can simplify the model validation workflow.
Pricing and Access
Arize AI offers usage-based pricing with clear tiers:
| Tier | Key Features | Ideal For |
|---|---|---|
| Free | Core observability, 15-day data retention, community support. | Individuals and small teams for evaluation and early-stage projects. |
| Pro | Longer retention, higher usage limits, standard support. | Growing teams moving models into production with moderate scale. |
| Enterprise | Full security (SOC 2, HIPAA), dedicated support, advanced features. | Large organizations with strict security, compliance, and scalability needs. |
Limitations
The free tier's short data retention period (7-15 days) and low data ingestion limits can be exhausted by high-throughput models. Advanced features and the capacity to handle large-scale data volumes are reserved for paid plans.
Website: https://arize.com
3. Fiddler AI
Fiddler AI is an enterprise Model Performance Management (MPM) platform that prioritizes governance, fairness, and explainability alongside core monitoring. It is designed for organizations in regulated industries, offering tools to track performance and justify model behavior.
The platform’s differentiator is its dual deployment flexibility, offering both a SaaS solution and a fully on-premises option. This allows enterprises to maintain control over their data, a requirement for many financial services and healthcare organizations. Fiddler AI provides machine learning model monitoring tools that connect data science teams and governance, risk, and compliance (GRC) functions.
Key Features and Implementation
- Deployment Model: SaaS (cloud-hosted) or fully on-premises for maximum data control.
- Core Capabilities: Provides performance monitoring (drift, data integrity, outliers), explainability (XAI) for individual predictions, and dedicated fairness and bias analysis dashboards.
- Use-Case Suitability: Suited for enterprises in regulated sectors like finance, insurance, and healthcare that require auditable AI, bias detection, and strong governance controls.
- Integration: Designed to integrate with enterprise security protocols like SSO and supports role-based access controls for collaboration between technical and GRC teams.
Fiddler's explainability and fairness features can translate complex model metrics into insights for non-technical stakeholders.
Pricing and Access
Fiddler AI's pricing is tailored for enterprise customers and requires direct engagement with their sales team.
| Tier | Key Features | Ideal For |
|---|---|---|
| Starter | Core monitoring, explainability, and fairness features. | Teams starting with a limited number of models. |
| Enterprise | Full platform capabilities, advanced security, on-prem option, premium support. | Large organizations with strict security, governance, and scalability needs. |
Limitations
The lack of a fully self-serve, transparently priced plan for production use can be a barrier for teams wanting to experiment at scale without a sales commitment. The pricing structure often involves annual contracts and pre-commitments.
Website: https://www.fiddler.ai
4. Evidently AI
Evidently AI is an open-source framework for ML and LLM observability. It appeals to developer-first teams by providing an Apache 2.0 licensed core that can be self-hosted, complemented by a commercial Evidently Cloud platform for dashboarding and alerting at scale. This approach offers a path from local development to production monitoring.
The platform's strength lies in its library of over 100 pre-built metrics and statistical tests covering data drift, model quality, and specific LLM/RAG system behaviors. This allows teams to generate interactive dashboards and JSON profiles directly from Python environments, making it one of the more accessible machine learning model monitoring tools for code-first workflows.
Key Features and Implementation
- Deployment Model: Open-source (self-hosted) or SaaS via Evidently Cloud.
- Core Capabilities: Provides built-in metrics for drift, data quality, and model performance. Supports test suites, alerting, tracing, and the ability to work from raw data logs or summary reports.
- Use-Case Suitability: Suited for Python-centric data science and ML engineering teams who prefer a code-first, open-source tool for initial validation and monitoring.
- Integration: Natively integrates into Python-based ML workflows and can be deployed with tools like Airflow for scheduled report generation or Grafana for visualization.
The open-source nature of Evidently AI's core, licensed under Apache 2.0, is a major differentiator. It provides organizations flexibility and control while offering a managed cloud option.
Pricing and Access
Evidently AI offers a straightforward pricing model for its cloud service:
| Tier | Key Features | Ideal For |
|---|---|---|
| Free | 1 user, 30-day retention, 1M rows/month, core monitoring. | Individuals and small teams for evaluation and small projects. |
| Team | 5 users, 90-day retention, 10M rows/month, alerts. | Small to medium teams deploying models in production. |
| Enterprise | Custom users & retention, SSO, audit logs, dedicated support. | Large organizations requiring advanced security and governance. |
Limitations
The lower-tier cloud plans have caps on data retention and monthly data rows that may be insufficient for high-throughput applications. Key enterprise features, such as SSO and detailed audit logs, are exclusively available on the custom Enterprise plan.
Website: https://www.evidentlyai.com
5. WhyLabs (whylogs + AI Control Center OSS)
WhyLabs offers an open-source approach to AI observability, centered around its whylogs library for data profiling and the open-source AI Control Center for visualization. This code-first stack is engineered for teams that prioritize control, transparency, and no vendor lock-in, allowing them to self-host and customize their monitoring infrastructure.
The core is whylogs, a library that generates lightweight statistical summaries of data, known as profiles. These profiles can be created with minimal overhead directly within data pipelines, making it an efficient option for large-scale deployments. The AI Control Center uses these profiles to detect anomalies, track data drift, and enforce model quality through YAML-based policies and LLM guardrails.
Key Features and Implementation
- Deployment Model: Fully self-hosted via open-source components (
whylogslibrary and AI Control Center). - Core Capabilities: Lightweight statistical profiling, profile comparison for drift detection, anomaly detection, and a policy builder for setting up LLM guardrails.
- Use-Case Suitability: Suited for engineering-heavy teams that require a fully customizable, self-hosted monitoring solution. It works well in high-volume data environments where profiling overhead is a concern.
- Integration: As a collection of libraries and services, it is designed to be integrated into existing Python-based data pipelines, Spark jobs, and ML frameworks.
The ability to generate data profiles with minimal computational cost and manage them in a fully open-source, self-hosted environment gives teams a high degree of control.
Pricing and Access
The WhyLabs stack, including whylogs and the AI Control Center, is open-source and free to use.
| Tier | Key Features | Ideal For |
|---|---|---|
| Open Source | Full access to whylogs library, self-hosted AI Control Center, anomaly detection, and LLM guardrails. | Organizations seeking a free and fully controllable monitoring solution without vendor dependencies. |
Limitations
The primary limitation is the operational overhead required for self-hosting and maintaining the AI Control Center. This approach demands dedicated engineering resources. Enterprise-specific features like SAML/SSO or advanced role-based access control may require custom implementation. It's important for organizations to assess their AI governance needs to ensure the required features are available or can be built.
Website: https://whylabs.ai
6. Seldon
Seldon provides a Kubernetes-native machine learning deployment platform that integrates model serving with monitoring capabilities. Its strength lies in treating monitoring as a core component of the production ML lifecycle. This is primarily achieved through its open-source library, Alibi Detect, which offers algorithms for detecting outliers, drift, and adversarial attacks.
The platform is engineered for teams operating within a Kubernetes ecosystem, leveraging Custom Resource Definitions (CRDs) for declarative deployments. This approach unifies the configuration for serving and monitoring. For organizations looking beyond the open-source offerings, Seldon Core+ provides enterprise-grade enhancements.
Key Features and Implementation
- Deployment Model: Primarily self-hosted on Kubernetes, with open-source and commercial offerings.
- Core Capabilities: Real-time and batch monitoring for drift, outliers, and adversarial inputs. It features declarative detectors via Alibi Detect and follows the Open Inference Protocol for standardized model communication.
- Use-Case Suitability: Suited for MLOps teams with Kubernetes expertise who need to manage the entire model lifecycle within a unified environment.
- Integration: Natively integrates with the Kubernetes ecosystem (e.g., Istio, Knative) and standard MLOps tooling.
Seldon’s integrated serving and monitoring architecture is a key differentiator. Defining drift detectors in the same deployment manifest as the model itself simplifies operations.
Pricing and Access
Seldon’s model is built around its open-source core with commercial add-ons:
| Tier | Key Features | Ideal For |
|---|---|---|
| Open Source | Core serving, Alibi Detect library, community support. | Teams comfortable with managing Kubernetes infrastructure for smaller-scale production. |
| Enterprise | Advanced monitoring dashboards, LLM Ops, audit trails, dedicated support. | Large organizations requiring robust governance and scalable management of production models. |
Limitations
The dependency on Kubernetes introduces a learning curve for teams not already proficient with the platform. Recent licensing changes to the Business Source License (BSL) for some components mean that production use often necessitates a paid subscription.
Website: https://www.seldon.io
7. Databricks Lakehouse Monitoring
Databricks Lakehouse Monitoring is an integrated solution designed to provide monitoring for all data and AI assets within the Databricks ecosystem. It leverages the platform's core architecture to track data quality, model performance, and drift, making it a natural choice for organizations already committed to the Databricks Lakehouse.
Its primary advantage is the native integration that reduces the need for external tooling. By storing metrics in Delta tables and using Inference Tables to log serving payloads, it provides a centralized record of model behavior. This approach simplifies root-cause analysis and supports governance by tying monitoring to data lineage within Unity Catalog.
Key Features and Implementation
- Deployment Model: Fully integrated within the Databricks SaaS platform.
- Core Capabilities: Offers automated monitoring for data drift, data quality, and model performance. It features auto-generated dashboards, configurable alerts, and Inference Tables for capturing real-time serving requests and responses.
- Use-Case Suitability: Suited for enterprises that have standardized on Databricks for data engineering and machine learning.
- Integration: Native to Databricks, with deep integration into Unity Catalog, Delta Lake, and Model Serving.
The ability to analyze monitoring metrics using standard SQL directly on Delta tables allows data teams to use familiar tools for investigations without exporting data to a separate system.
Pricing and Access
Pricing for Lakehouse Monitoring is not a separate license fee but is based on the underlying Databricks compute and storage consumed.
| Tier | Key Features | Ideal For |
|---|---|---|
| All Tiers | Based on consumption of Databricks compute (DBUs) and storage. | Organizations of all sizes already using or migrating to Databricks. |
Limitations
The primary limitation is its platform dependency; it is exclusively designed for the Databricks ecosystem. The consumption-based pricing model can make costs less predictable, as expenses are tied directly to compute and storage usage.
Website: https://www.databricks.com
8. Google Cloud Vertex AI Model Monitoring
Google Cloud's Vertex AI Model Monitoring is a managed service designed for teams integrated into the Google Cloud Platform (GCP) ecosystem. It operates as a native component of the Vertex AI platform, offering a way to monitor models deployed as Vertex Endpoints. This integration simplifies the monitoring setup for organizations already leveraging GCP.
The service focuses on detecting drift in statistical data properties and feature attributions. It directly connects to data sources like BigQuery and the Vertex AI Feature Store, creating an operational loop within a single cloud environment. This native approach reduces the integration overhead associated with third-party monitoring tools.
Key Features and Implementation
- Deployment Model: Fully managed service within the Google Cloud Platform.
- Core Capabilities: Provides automated monitoring for training-serving skew and prediction drift, with alerts and visualizations integrated into the Vertex AI console. It supports explainability-based monitoring for feature attribution drift.
- Use-Case Suitability: Suited for enterprises that have standardized on GCP for their MLOps lifecycle.
- Integration: Natively integrates with the entire Vertex AI suite, including pipelines, endpoints, and data services.
The key advantage of Vertex AI Model Monitoring is its operational simplicity. For a team managing models on Vertex AI, enabling drift detection is a configuration step within their existing deployment process.
Pricing and Access
Vertex AI Model Monitoring employs a pay-as-you-go pricing model based on the volume of data analyzed.
| Service | Pricing Metric | Cost |
|---|---|---|
| Model Monitoring | Per GB of data analyzed | Varies by region (e.g., $2.50 per GB in us-central1) |
| Explainable AI | Per node hour for predictions | Varies by machine type |
Limitations
The primary limitation is its vendor lock-in; the service is designed exclusively for models deployed within or logged to the Vertex AI platform. This makes it unsuitable for organizations with multi-cloud or hybrid deployment strategies. The per-GB pricing costs can escalate for high-throughput models. It also requires careful setup to ensure compliance with emerging regulations, a consideration for organizations preparing for the EU AI Act.
Website: https://cloud.google.com/vertex-ai
9. AWS SageMaker
AWS SageMaker offers an end-to-end managed platform for the machine learning lifecycle, with model monitoring integrated into its ecosystem. It is a comprehensive suite where monitoring is a native feature. This makes it a choice for enterprises already invested in the AWS cloud, seeking unified operations for their AI workloads. The platform's strength lies in its integration with other AWS services like CloudWatch and S3.
This native integration simplifies operational overhead, as monitoring data and logs are handled within a familiar environment. SageMaker provides built-in capabilities to detect data drift, concept drift, model quality issues, and fairness or bias, making it a robust option for organizations requiring enterprise-grade machine learning model monitoring tools.
Key Features and Implementation
- Deployment Model: Fully managed service within the AWS cloud.
- Core Capabilities: Provides Model Monitor for tracking data and concept drift, Model Quality Monitor for evaluating prediction accuracy, and Clarify for detecting bias.
- Use-Case Suitability: Best suited for large enterprises that have standardized on AWS and need a fully managed solution that covers the entire ML lifecycle.
- Integration: Natively integrates with the AWS ecosystem, including S3 for data storage, CloudWatch for alerts and logging, and AWS Identity and Access Management (IAM) for security.
The ability to set up monitoring jobs that run on flexible compute and store results in S3, all managed through a single console or API, reduces integration friction for AWS-native teams.
Pricing and Access
SageMaker's pricing is component-based and depends on usage across its various features:
| Component | Pricing Model | Key Considerations |
|---|---|---|
| Monitoring Jobs | Per instance-hour for processing. | Cost is influenced by the instance type chosen and the frequency of monitoring schedules. |
| Data Storage | Standard S3 pricing for storing baselines, constraints, and violation reports. | Storage costs can accumulate over time with frequent monitoring. |
| Logging/Alerts | Standard CloudWatch pricing for logs, metrics, and alarms. | Monitoring costs are spread across both SageMaker and CloudWatch services. |
Limitations
The componentized pricing model can be complex. Calculating the total cost of ownership (TCO) can be challenging, as expenses are spread across SageMaker jobs, S3 storage, and CloudWatch metrics.
Website: https://aws.amazon.com/sagemaker
10. Microsoft Azure (Azure ML + Azure Monitor)
For organizations invested in the Microsoft ecosystem, leveraging native services for model monitoring is an integrated approach. Monitoring in Azure combines Azure Machine Learning for deployment and metric logging with Azure Monitor and Log Analytics for data ingestion, alerting, and visualization. This native integration offers a seamless experience for teams already managing infrastructure within the Azure cloud.
This setup allows for robust governance and security controls, inheriting identity management from Azure Active Directory. While it requires assembling different services, the benefit is control over the underlying components. This makes it one of the more flexible machine learning model monitoring tools for Azure-native enterprises, though it requires more configuration than all-in-one platforms.
Key Features and Implementation
- Deployment Model: Cloud-native components within the Microsoft Azure ecosystem.
- Core Capabilities: Utilizes Azure Monitor for ingesting logs and metrics from deployed models, with alerting and customizable dashboards. It can be enhanced with services like Metrics Advisor for time-series anomaly detection.
- Use-Case Suitability: Suited for enterprises that have standardized on Azure for their data and IT infrastructure.
- Integration: Natively integrates with the entire Azure stack, including Azure ML, Azure DevOps, and Power BI.
The primary advantage of the Azure approach is the consolidation of billing and governance. All monitoring costs are part of the existing Azure bill, and access controls are managed through familiar Azure IAM roles.
Pricing and Access
Azure's pricing is component-based and depends entirely on usage.
| Component | Pricing Model | Key Cost Drivers |
|---|---|---|
| Azure Monitor Logs | Pay-as-you-go or Commitment Tiers | Data ingestion volume and data retention duration. |
| Azure Machine Learning | Pay-as-you-go | Compute for model endpoints, storage for artifacts. |
| Alerting | Per-alert rule and notification type | Number of active alert rules and notifications sent. |
Limitations
The primary challenge is complexity. The user experience is distributed across the Azure Machine Learning studio and the Azure Monitor portal. Calculating the total cost can be difficult as it involves multiple meters for log ingestion, retention, compute, and alerts.
Website: https://azure.microsoft.com
11. Datadog
Datadog is an observability suite known for infrastructure and application performance monitoring (APM). It has extended its capabilities into ML/LLM observability, making it a choice for organizations that want to monitor AI systems within the context of their entire technology stack. This approach allows DevOps and MLOps teams to correlate model behavior with underlying infrastructure metrics from a single platform.
The platform tracks operational and cost metrics for Large Language Models. It offers features for monitoring LLM costs, token usage, and performance breakdowns by provider or model. For engineering leaders, this consolidates views of application, infrastructure, and LLM telemetry.
Key Features and Implementation
- Deployment Model: SaaS (cloud-hosted).
- Core Capabilities: Provides LLM observability (cost, tokens), APM traces, customizable dashboards, and anomaly detection alerts.
- Use-Case Suitability: Best suited for teams already using Datadog for APM who want to add model-aware operational monitoring. It excels at tracking LLM costs and usage alongside application logs and infrastructure health.
- Integration: Features over 1,000 integrations.
Datadog's value proposition is its ability to break down silos. Viewing an LLM trace alongside application logs and infrastructure metrics in one interface can reduce the mean time to resolution for production incidents.
Pricing and Access
Datadog uses a modular, usage-based pricing model.
| Module | Key Features | Ideal For |
|---|---|---|
| LLM Observability | Ingestion and visualization of LLM traces, costs, and metadata. | Teams needing to track and manage the operational costs and usage of LLMs. |
| APM & Continuous Profiler | End-to-end distributed tracing and code-level performance insights. | Organizations requiring deep application performance analysis. |
| Log Management | Centralized log collection, processing, and analytics. | Teams needing to correlate logs with application and model behavior. |
Limitations
While useful for operational and cost monitoring, Datadog's core offering is not a specialized machine learning model monitoring tool. Deeper model performance metrics, such as statistical drift detection or bias analysis, require custom instrumentation. Costs can escalate as data volumes grow and more modules are adopted.
Website: https://www.datadoghq.com
12. Superwise
Superwise is an AI operations and governance platform focused on providing runtime guardrails and real-time observability for ML and agentic AI systems. It emphasizes policy-driven controls and inline interventions, making it a candidate for organizations in regulated industries where risk management is paramount. The platform is designed for active governance of AI decisions.
This focus on runtime control allows teams to enforce business rules and compliance requirements directly within the operational flow of their AI agents and models. Superwise offers a path for teams to implement governance frameworks, starting with a free community tier and scaling up to enterprise-level deployments.
Key Features and Implementation
- Deployment Model: SaaS (cloud-hosted).
- Core Capabilities: Specializes in runtime guardrails, policy-driven controls, and real-time observability of AI decisions and agentic behaviors.
- Use-Case Suitability: Suited for regulated sectors like finance and healthcare, or applications where AI decisions require policy enforcement and auditable governance.
- Integration: Designed to integrate into existing MLOps pipelines to add a layer of governance over deployed models and agents.
Superwise's ability to enforce policies in real time, not just detect violations after the fact, provides a control layer for high-stakes applications.
Pricing and Access
Superwise offers a structured pricing model:
| Tier | Key Features | Ideal For |
|---|---|---|
| Community Starter | Foundational monitoring and guardrails for up to 2 models/agents. | Individuals and small teams looking to explore AI governance concepts. |
| Pro | Expanded capabilities for production use cases with more models. | Teams deploying and scaling multiple AI applications needing robust controls. |
| Enterprise | Custom solutions, advanced security, and dedicated support. | Large organizations with strict compliance, security, and scalability needs. |
Limitations
The platform's recent focus on agentic AI and LLM governance means its feature set for classic ML performance KPIs may require more customization compared to tools dedicated to traditional model monitoring. Pricing for the Pro and Enterprise tiers is not publicly listed and requires direct sales engagement.
Website: https://superwise.ai
12 ML Model Monitoring Tools — Comparison
| Solution | Core focus / Key features | Target audience | Unique selling points | Pricing & deployment |
|---|---|---|---|---|
| ManageAI Platform — AI Performance Monitoring (DSG.AI) | 50+ configurable monitors (perf, data quality, risk, security, compliance), real-time alerts, continuous optimization | Enterprises with production-scale ML/LLM and regulatory needs | Architecture-first, tech-agnostic, 6‑week ROI onboarding, full IP & source-code control, EU AI Act readiness | Enterprise deployment; rapid implementation; no vendor lock‑in |
| Arize AI | Online/offline evaluations, tracing (OpenTelemetry), custom dashboards, token/cost tracking | Teams seeking quick trial & clear tiering, MLOps teams | Self-hostable Phoenix OSS, published Free/Pro/Enterprise tiers | SaaS metered plans + self-hosted OSS; free tier retention limits |
| Fiddler AI | Performance/drift monitoring, fairness & explainability, role-based access | Regulated enterprises needing explainability & governance | Strong bias/fairness tooling, on‑prem/cloud options, compliance posture | Enterprise pricing, typically annual terms; sales engagement |
| Evidently AI | 100+ metrics (drift, data quality, LLM/RAG), tests, alerting, OSS core | Developer-first teams, Python-centric MLOps | Apache‑2.0 open-source core, low-cost cloud tiers, fast trial | Open-source + Evidently Cloud; tiered retention/row caps |
| WhyLabs (whylogs + AI Control Center OSS) | Statistical profiling, anomaly detection, declarative LLM guardrails | Teams prioritizing efficient profiling and full OSS stack | Fully open-source stack, low-overhead profiling, strong docs | Self-hosted OSS; hosted SaaS sunset — operational effort required |
| Seldon | Kubernetes-native model serving + monitoring, Alibi Detect detectors | Teams running K8s-based model serving at scale | Tight serve-monitor integration, rich detectors (drift/outliers) | Open-source + commercial Core+; K8s expertise needed, licensing changes |
| Databricks Lakehouse Monitoring | Data + model monitoring, Delta metric storage, inference tables | Organizations already on Databricks Lakehouse | Native integration, lineage (Unity Catalog), RCA via SQL | Included in Databricks usage — costs tied to compute/storage |
| Google Cloud Vertex AI Model Monitoring | Drift/perf monitoring, Batch Explain, Feature Store integration | GCP-based teams using Vertex endpoints | Tight GCP integration, per-GB metering, easy enablement for Vertex | Managed GCP service, priced per GB analyzed, region-limited |
| AWS SageMaker | Drift/data quality/bias monitors, CloudWatch/S3 integration | AWS-centric enterprises needing global availability | Deep AWS ecosystem integration, procurement via AWS accounts | Managed AWS service; componentized pricing (instances, storage, logs) |
| Microsoft Azure (Azure ML + Azure Monitor) | Log/metric ingestion, anomaly detection, integration with Azure governance | Azure-first organizations & enterprise IT estates | Leverages Azure identity/governance, flexible log/retention controls | Multi-meter costs (logs, compute); distributed UX across services |
| Datadog | LLM observability (costs/tokens), APM, traces, infra & logs | Teams wanting consolidated app + infra + model telemetry | Mature enterprise platform, 1,000+ integrations, modular pricing | SaaS with modular add-ons; costs scale with volume and modules |
| Superwise | Runtime guardrails, policy-driven controls, real-time observability | Regulated use cases, agentic AI and LLM governance | Inline guardrails for agents, policy & advisory support, Starter tier | SaaS with starter tier; larger deployments require sales/pricing plan |
Making the Right Choice for Your Enterprise AI Strategy
Navigating the landscape of machine learning model monitoring tools can be complex. Making an informed choice is a critical step toward ensuring the reliability, compliance, and value of your AI initiatives. The analysis of tools ranging from cloud-native platforms like AWS SageMaker to open-source solutions like Evidently AI and enterprise-focused systems like Arize reveals a clear pattern: there is no single best tool, only the right tool for your specific operational context.
Your decision hinges on a strategic evaluation of your organization's unique requirements. A deep commitment to a single cloud provider might make integrated solutions from Google, AWS, or Microsoft the most efficient path. A developer-centric culture that prioritizes customization may find the flexibility of open-source tools like WhyLabs and Seldon more appealing, provided they have the engineering resources to manage the infrastructure overhead.
Key Factors for Your Evaluation
As you move from consideration to decision, focus on these factors to guide your selection process:
-
Ecosystem and Integration: Assess how a potential tool fits into your existing MLOps stack. A solution that requires re-architecting your data pipelines will introduce friction. Tools with robust APIs and pre-built integrations offer an advantage for complex environments.
-
Governance and Compliance: For organizations in regulated industries or preparing for legislation like the EU AI Act, governance is a primary concern. Scrutinize a tool’s capabilities for model explainability, audit trails, and bias detection. Platforms that provide model risk management and documentation are essential for demonstrating compliance.
-
Scalability and Total Cost of Ownership (TCO): Look beyond the initial license fee. Consider the costs associated with implementation, infrastructure, maintenance, and the personnel required to operate the tool. A solution that is easier to implement and manage, like DSG.AI’s manageAI Monitoring, can offer a lower TCO, especially for teams managing a diverse portfolio of models.
-
Business Alignment: The goal of monitoring is to protect business value. The right tool must provide not just technical metrics but also clear, business-relevant insights. Can you configure monitors to track key performance indicators (KPIs) like customer churn risk or fraud detection rates? This connection transforms monitoring from a technical necessity into a strategic asset. A comprehensive enterprise AI strategy also considers the integration of various AI-powered marketing tools and other applications, which benefit from a centralized governance approach.
Your Path Forward
The journey to effective AI oversight begins with an understanding of your current state and future goals. Start by inventorying your production models, identifying high-risk applications, and defining core monitoring requirements. Use this framework to short-list vendors and conduct proof-of-concept projects that test their capabilities against your real-world use cases.
Choosing the right partner for machine learning model monitoring is a foundational decision for your enterprise AI strategy. It is an investment in resilience and a commitment to responsible AI. By selecting a tool that aligns with your technical, operational, and governance needs, you empower your organization to catch problems before they impact the business and to unlock the full potential of your AI investments.
If your enterprise needs a technology-agnostic monitoring platform designed for rapid implementation, stringent governance, and zero vendor lock-in, DSG.AI can help. Our manageAI Monitoring solution provides the configurable, enterprise-grade oversight required to secure and scale your diverse AI portfolio with confidence. Explore how we can accelerate your path to production-ready AI at DSG.AI.