Written by:
Editorial Team
Editorial Team
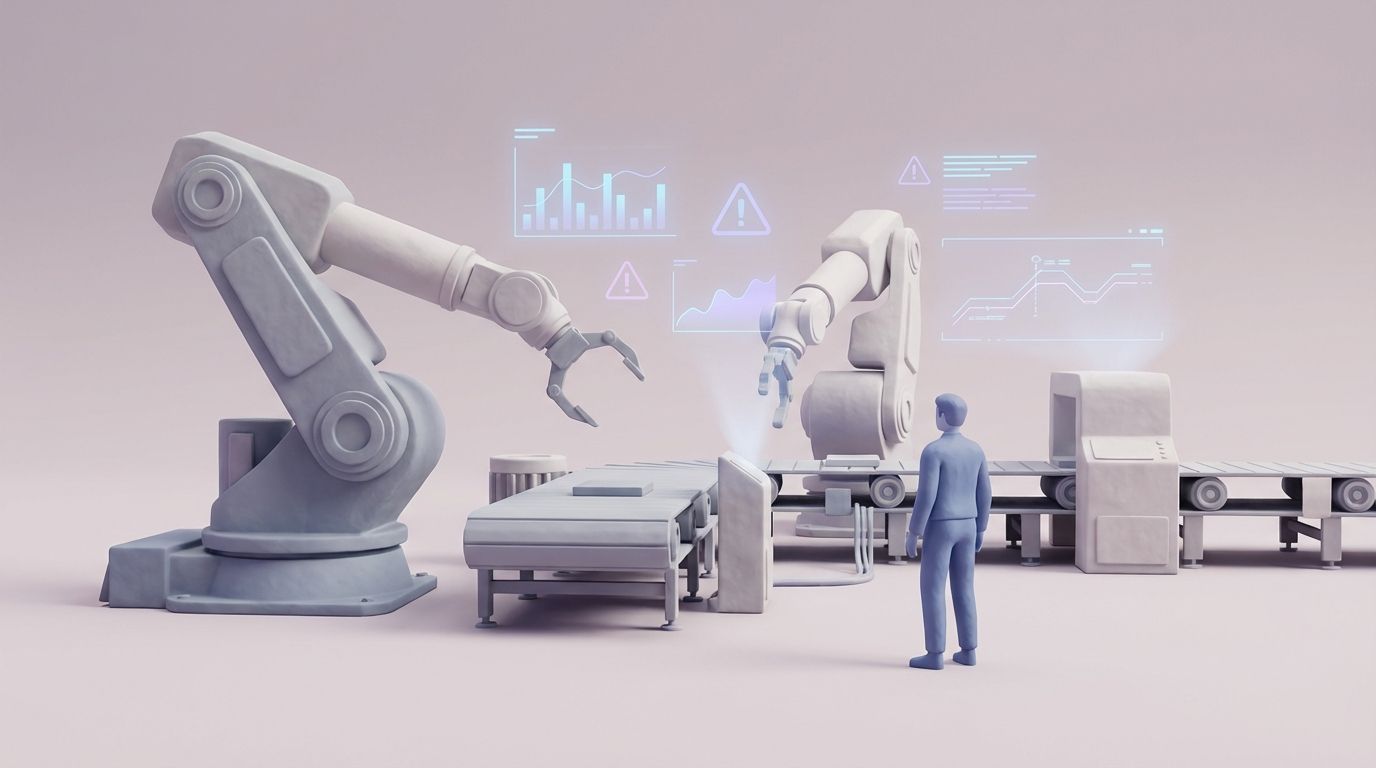
To reduce downtime in manufacturing, operations must shift from a reactive "fix-it-when-it-breaks" model. This approach is no longer competitive. A proactive strategy built on operational data is required. This strategy should calculate the full cost of a shutdown, including indirect costs like contract penalties and brand damage. With a clear financial baseline, manufacturers can implement data-driven tools to predict and prevent failures.
Calculate the True Cost of a Silent Factory Floor

When a production line stops, the financial impact extends beyond lost output. It affects the supply chain and customer relationships. A single equipment failure can create a domino effect. For example, a missed production target might trigger contractual penalties. This can lead to increased costs from expedited shipping to meet deadlines, reducing profit margins. Every minute of unplanned downtime contributes to a significant financial loss.
Beyond Lost Production Numbers
Tracking only the units not produced provides an incomplete financial picture. The actual cost of downtime includes several factors that are not immediately obvious:
- Wasted Labor Costs: Operators and technicians remain on the payroll during downtime, resulting in payment for idle time.
- Supply Chain Disruptions: Unexpected production halts can disrupt just-in-time inventory systems and strain supplier relationships.
- Reputational Damage: Consistently missing delivery dates erodes customer trust, which can lead to lost business over time.
The first step toward building a more resilient operation is to treat downtime as a critical business risk, not just an operational issue.
The crucial shift in mindset is moving from asking "How quickly can we fix it?" to "How can we ensure it never breaks?" This proactive stance is where modern, data-driven solutions create a lasting competitive advantage.
Quantifying the Financial Impact
Industry data shows that manufacturers experience an average of 800 hours of unplanned downtime annually. This equates to over 15 hours per week. For large enterprises, downtime can consume up to 11% of annual turnover, according to a 2022 report by Senseye.
Equipment failure is the primary cause in 80% of these cases. The automotive industry is particularly affected, with downtime costs reaching $2.3 million per hour, a figure that has doubled since 2019. You can discover more insights about the true cost of machine downtime from detailed industry analysis.
The hourly cost varies by sector. It is influenced by the products manufactured, production line complexity, and supply chain dependencies.
Financial Impact of Downtime Across Manufacturing Sectors
| Manufacturing Sector | Average Cost of Downtime per Hour | Primary Cost Drivers |
|---|---|---|
| Automotive | Up to $2.3 million | Just-in-time assembly lines, high-value components, labor |
| Pharmaceuticals | $500,000 - $1 million | Batch integrity loss, regulatory compliance, spoilage |
| Food & Beverage | $150,000 - $300,000 | Perishable goods, sanitation resets, supply chain delays |
| Electronics | $100,000 - $250,000 | Complex assembly, high-value parts, yield loss |
| Heavy Industry | $75,000 - $200,000 | Capital-intensive machinery, energy consumption, safety |
These figures show that a reactive maintenance plan is not sustainable. To protect financial performance and competitiveness, technology leaders must adopt a more strategic approach. Using predictive analytics, they can anticipate failures and schedule maintenance proactively, converting a significant liability into an operational strength.
Identify the Root Cause of Production Halts
To effectively reduce downtime, it is necessary to identify the underlying causes. When a motor fails, replacing it is a temporary fix. The key is to understand why it failed. Potential causes could be poor lubrication, excessive vibration, or an electrical surge. Answering these questions enables a shift from reactive problem-solving to a proactive strategy that prevents failures.
This requires a new perspective on downtime. The root causes are no longer limited to the physical wear of machinery. The convergence of operational technology (OT) and information technology (IT) has introduced new types of disruptions.
The Growing Threat Where OT and IT Collide
Mechanical failures like a broken gear or a burnt-out pump still occur. However, many production stoppages now originate in the digital infrastructure that controls physical assets. These cyber-physical disruptions can be more difficult to trace than simple component failures.
A modern factory floor is a network of connected devices, including unpatched Programmable Logic Controllers (PLCs) and legacy Human-Machine Interfaces (HMIs). Flat network architectures can create vulnerabilities. Without real-time visibility into OT traffic, a minor network issue or a cyberattack can halt a production line.
Analysis shows that UK and European manufacturers are projected to lose over £80 billion from downtime, with a significant portion resulting from OT-related issues. Furthermore, 31% of manufacturers have reported direct financial losses from cyberattacks on their converged OT/IT systems. You can see the full impact of these OT-driven disruptions and understand why this is reshaping maintenance priorities.
How to Conduct an Effective Downtime Audit
A structured downtime audit provides clarity to focus efforts where they will have the greatest impact. This is a systematic investigation to uncover operational weaknesses. An effective audit can be structured around three core pillars.
Pillar 1: Equipment Health Assessment
This pillar involves analyzing historical data to identify problematic machines or components.
- Failure Mode and Effects Analysis (FMEA): For critical assets, map every potential failure mode, its cause, and its effect on production.
- Mean Time Between Failures (MTBF): Calculate the MTBF for key equipment to establish a baseline. A downward trend in MTBF is an early warning sign.
- Sensor Data Analysis: Analyze historical sensor data for anomalies in vibration, temperature, or pressure that preceded past failures.
Pillar 2: Process and Workflow Analysis
Downtime is not always caused by equipment. Inefficient processes, material shortages, or poor communication can lead to lost productivity.
- Value Stream Mapping: Visually map the entire production process to identify bottlenecks.
- Changeover Times: Analyze the time it takes to switch a line from one product to another. Long or inconsistent changeovers are a source of planned downtime that can often be reduced.
- Operator Interviews: Speak with the people who operate the machines daily. They can provide insights into recurring issues that data alone may not reveal.
Pillar 3: Data and Network Infrastructure Review
Examine the digital infrastructure of your operations. An inadequate infrastructure can undermine even the best strategy.
- Data Accessibility: Ensure real-time and historical data from PLCs, SCADA systems, and CMMS are accessible. Data in silos is not useful.
- Network Security: Evaluate network vulnerability. OT systems should be properly segmented from the corporate IT network with appropriate firewalls and access controls.
- System Integration: Verify that key systems, like your CMMS and ERP, are integrated. Lack of integration can cause delays in creating work orders and obtaining spare parts.
By analyzing these three areas, you can move from reacting to problems to strategically solving them. This multi-faceted audit provides the evidence needed to identify high-impact improvement areas and build a business case for an AI-driven predictive maintenance program.
Lay the Groundwork for Your AI Predictive Maintenance Program
After identifying the causes of production stoppages, the next step is to build a system for prevention. Implementing an AI-powered predictive maintenance program is a methodical process. It involves layering data, intelligence, and automation to create a resilient operation.
The objective is to shift maintenance from a reactive to a proactive activity. This involves fixing potential issues weeks before they can cause a shutdown. The process begins with a solid architectural foundation that can convert raw shop floor data into automated, actionable work orders. A well-designed architecture creates a scalable system that integrates with your existing technology stack, avoiding vendor lock-in.
Getting the Right Data from the Shop Floor
The quality of your predictive maintenance program depends on the quality of its data. A consistent stream of relevant, high-quality data is essential for AI models to be effective.
First, identify your most critical assets. These are the machines that would cause the largest financial impact if they failed. Focusing initial efforts on these high-impact assets can deliver a faster return on investment.
Next, ensure these critical assets are properly instrumented. Many new machines have built-in sensors, but older equipment may need to be retrofitted.
Key sensor types include:
- Vibration Sensors: These are effective for detecting early mechanical wear in rotating equipment like motors, pumps, and gearboxes.
- Thermal Imagers: Heat can indicate electrical problems or friction. Continuous temperature monitoring can detect these issues before they lead to failure.
- Acoustic Sensors: Machines often sound different before they fail. Acoustic sensors can detect subtle changes in operational noise that the human ear might miss.
- Pressure and Flow Sensors: These are essential for hydraulic and pneumatic systems, providing direct insight into system performance and detecting leaks or blockages.
Collecting data is not enough. It needs context. This means integrating sensor data with other sources, such as historical failure records from your Computerized Maintenance Management System (CMMS) and operational context from your Manufacturing Execution System (MES).
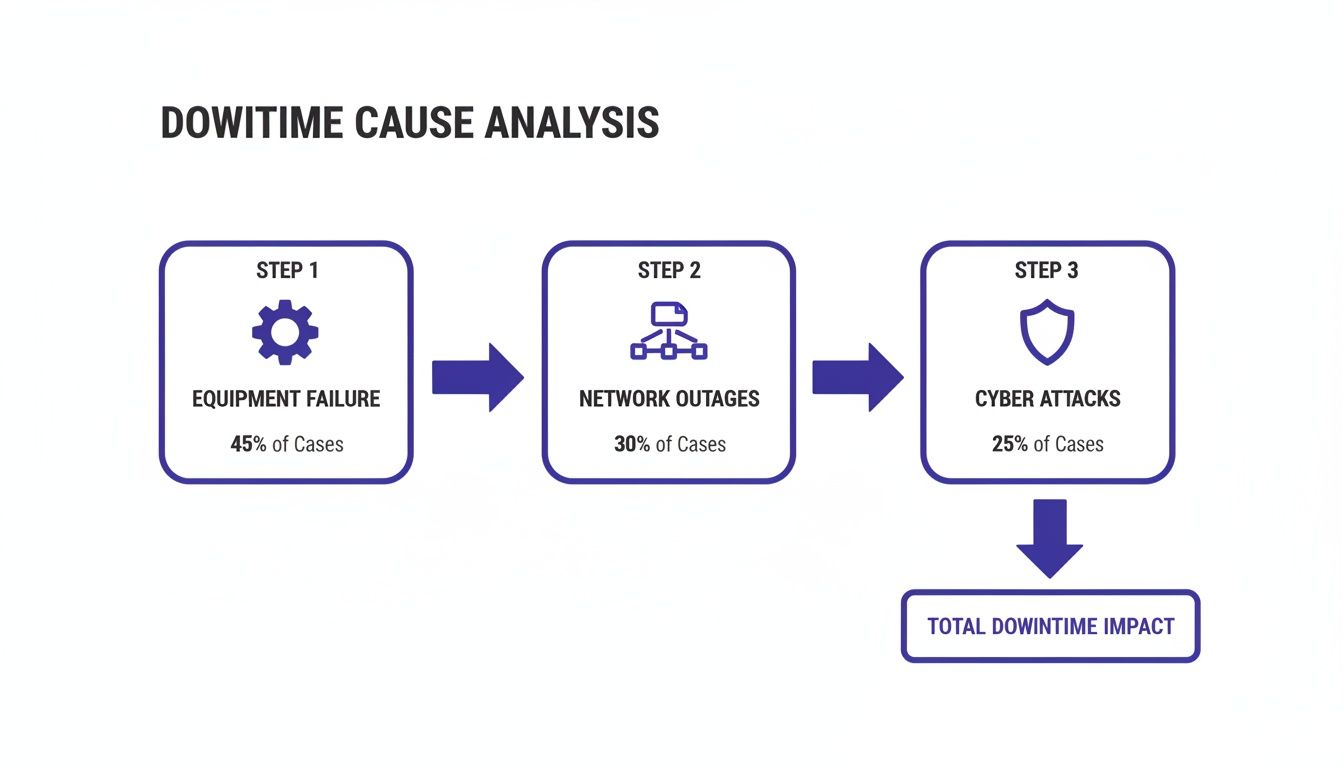
While equipment failure accounts for a large portion of downtime (45%), a comprehensive strategy must also consider the digital infrastructure, including network outages (30%) and cyber attacks (25%).
Building the Models That Do the Predicting
With a reliable data stream, you can build machine learning models. These models analyze real-time sensor data, comparing it against historical patterns to identify anomalies—small deviations from normal behavior that indicate potential problems.
For a deeper understanding of creating virtual replicas of physical assets, you can read about building your digital twin. This is a useful way to visualize and understand machine behavior.
In practice, this usually involves two types of models working together:
- Anomaly Detection Models: These act as an early warning system. They learn what "normal" behavior looks like from healthy equipment data and flag any deviations.
- Failure Prediction Models: When an anomaly is detected, these more advanced models are activated. Using historical failure data, they confirm a problem, forecast the probability of a specific failure, and estimate the Remaining Useful Life (RUL) of the component.
A predictive system provides specific, actionable insights. It doesn't just say, "This motor is vibrating abnormally." It says, "There is a 90% probability that Bearing 7 will fail within the next 150-200 operating hours."
This level of insight transforms maintenance from an emergency response into a planned event. You can schedule repairs during planned stops, order parts in advance, and assign the right personnel.
Automating the Maintenance Workflow
The final step is integration. A prediction is only useful if it triggers a real-world response. Automation is the most effective way to achieve this. This means connecting the output from your AI models directly to your existing systems, such as your CMMS or Enterprise Resource Planning (ERP) platform.
When a model predicts a failure with high confidence, it can automatically trigger a workflow. For example:
- Generate a Work Order: The system creates a detailed work order in the CMMS, specifying the machine, the likely problem, and the necessary parts.
- Order Spare Parts: It can check inventory levels in the ERP and automatically order parts if needed, ensuring they arrive on time.
- Schedule Technicians: The system can check schedules and assign a technician with the appropriate skills for the repair.
This "closed-loop" automation turns insight into action without manual intervention. It ensures that alerts are not missed and allows your maintenance team to focus on high-value tasks. This intelligent, connected framework not only prevents downtime but also optimizes your entire maintenance operation for efficiency and cost.
Gauging Success: How to Measure and Prove Your ROI
An AI initiative must demonstrate a clear business impact to secure and maintain funding. A statement like "we want less downtime" is not a strategy. You need a solid framework for tracking key performance indicators (KPIs) and calculating a tangible return on investment (ROI).
This involves looking beyond simple metrics. A higher uptime percentage is a positive sign, but it doesn't explain the reasons behind the improvement. A full picture of operational health and the financial impact of your predictive maintenance program requires more nuanced metrics.
Moving Beyond Simple Uptime
To understand if your program is effective, track metrics that reflect equipment reliability, maintenance efficiency, and overall production effectiveness. These KPIs will show you what is working and where to focus your efforts.
Recommended metrics to focus on include:
- Mean Time Between Failures (MTBF): This metric measures reliability. It indicates the average time a piece of equipment runs before it fails. A steadily increasing MTBF provides evidence that your predictive efforts are preventing failures.
- Overall Equipment Effectiveness (OEE): OEE provides a holistic view by combining three factors: availability (runtime), performance (speed), and quality (good parts). An increase in OEE from 75% to 85% demonstrates that uptime improvements are leading to more high-quality products.
The goal is not just to keep machines running but to make every operational hour more productive. OEE connects machine health to business output, which is where the value lies.
Connecting the Dots to ROI
Calculating your ROI builds the business case for the program. The formula is straightforward, but it requires an honest assessment of both costs and financial gains.
The basic formula is: ROI = (Financial Gains - Cost of Investment) / Cost of Investment
The Cost of Investment typically includes:
- Sensors and other hardware
- Software licenses or development
- Cloud computing and data storage
- Man-hours for implementation and training
The Financial Gains demonstrate the program's power. The most significant gains come from recapturing lost production—manufacturing and selling products that would have been lost due to downtime.
Tracking the Right KPIs
To measure progress effectively, shift from lagging indicators (historical performance) to leading indicators (future performance). This table explains the difference.
KPIs for Measuring Downtime Reduction Initiatives
| Metric | Definition | Why It Matters | Target Improvement |
|---|---|---|---|
| Uptime % (Lagging) | Percentage of time equipment is operational. | A basic health check, but doesn't explain why. | Increase from 95% to 99% |
| MTBF (Lagging) | Average time between equipment failures. | A direct measure of reliability improvements. | Increase by 25%+ |
| OEE (Lagging) | A composite score of availability, performance, and quality. | The ultimate measure of manufacturing productivity. | Increase by 10-15 points |
| AI Model Accuracy (Leading) | Percentage of correct predictions made by the AI. | Ensures the foundation of your program is solid. | Maintain 90%+ accuracy |
| Alerts-to-Action Ratio (Leading) | Percentage of predictive alerts that lead to a maintenance action. | Measures user trust and the actionability of insights. | Achieve a ratio > 80% |
Focusing on leading indicators like model accuracy and the alerts-to-action ratio provides an early warning system for the health of your program, not just your equipment. This allows you to fine-tune the system before the lagging indicators decline.
A Synthetic Example
Here is a synthetic example to illustrate the calculation. Imagine a mid-sized automotive parts facility with $150 million in annual revenue.
- The Problem: The plant averages 400 hours of unplanned downtime per year. At a cost of $25,000 per hour in lost production, this results in a $10 million annual loss.
- The Solution: The company invests $1.2 million in a predictive maintenance program, including sensors, an AI software platform, and team training.
- The Result: In the first year, the program reduces unplanned downtime by 20%.
The numbers for this synthetic example are as follows:
A 20% reduction means they avoided 80 hours of failures (400 hours * 0.20).
The Financial Gain from that recovered time is 80 hours * $25,000/hour = $2,000,000.
Now for the ROI calculation:
ROI = ($2,000,000 gain - $1,200,000 cost) / $1,200,000 cost = 0.67
This represents a 67% return on investment in the first year. This is not just a technical discussion; it is a powerful financial argument that demonstrates the strategic value of the program to executive leadership.
Navigating Change Management and Team Buy-In

Implementing an AI predictive maintenance framework is not just a technology project; it is also a cultural one. The most sophisticated algorithms are ineffective if the people who need to use them do not trust them.
Success depends on genuine buy-in from all levels of the organization, from technicians to executives. This involves asking experienced professionals to trust a new system, which can be a significant change. Without their support, the insights generated by the AI will not be used.
Securing Stakeholder Commitment
Gaining support from all stakeholders is the first major challenge. Different groups have different priorities and concerns that need to be addressed directly.
- For C-Suite Executives: Focus on the financial impact. Present clear data on how the investment will increase OEE, reduce maintenance costs, and improve gross margin. Your ROI calculations are the foundation of this business case.
- For Shop Floor Technicians: Address concerns about job replacement. Frame the AI as a tool that empowers them, allowing them to shift from reactive firefighting to proactive problem-solving. Emphasize benefits like fewer unexpected weekend call-ins.
- For Operations Managers: Their focus is on production targets. Explain how predictive alerts lead to better scheduling, resource planning, and smoother operations, reducing last-minute disruptions.
A well-defined communication plan is essential. Learning how to use strategic communication to lead change is a critical skill for guiding your team through this transition.
Building Trust Through Governance and Training
Trust must be earned. An AI that functions like a "black box" will be met with skepticism. Transparency, training, and clear governance are necessary to build confidence.
A robust governance framework is not optional. You need defined processes for monitoring, validating, and updating models. When a model's predictions begin to drift, there must be a plan for retraining and redeployment. For an in-depth look at setting these standards, consider our guide on AI Act readiness.
The goal is to demystify the AI. Technicians should understand what data the model uses and the general logic behind its predictions. When they see the model successfully predict a failure they anecdotally suspected, trust begins to form.
Training should be practical and hands-on. Focus on interpreting alerts and taking appropriate action. Use real-world scenarios: an alert is generated, the team investigates, and the issue is resolved before it causes a shutdown.
Cultural inertia is a significant challenge. Unplanned downtime can consume 20% of a plant's capacity, and 67% of facilities still use a reactive maintenance approach. Furthermore, 74% of managers report that communication breakdowns turn minor issues into major shutdowns. Your AI initiative will only deliver lasting value if you build a culture that values and acts on data-driven insights.
Answering Common Questions About AI and Downtime
Introducing new technology to the factory floor raises questions. Leadership and engineering teams need practical answers, not just theory, when considering AI to maintain production lines.
Here are some of the most common challenges companies face.
What If Our Equipment Is Old and Lacks Sensors?
This is a frequent and valid concern, as most plants operate with a mix of old and new equipment. It is not necessary to replace all machinery.
A targeted asset criticality assessment is a more effective approach. Identify the machines that cause the most significant problems. Typically, 20% of your assets are responsible for 80% of the downtime. Start with these high-impact machines. Retrofitting them with modern, inexpensive IoT sensors for vibration and temperature is a relatively small investment with a high potential return.
Begin with a small-scale pilot project. Focus on your most problematic asset to prove the value. A measurable impact can often be demonstrated in as little as six weeks, providing the data needed to build a business case for expanding the program.
What Kind of Data Do We Actually Need?
An effective predictive model requires specific types of data to provide a complete picture of a machine's health. It is more about having the right data than having a large volume of it.
The key data types are:
- High-Frequency Sensor Data: This includes real-time data from the shop floor, such as vibration, temperature, pressure, and acoustic data. These are the raw signals indicating the current state of the machine.
- Maintenance Records: Data from your CMMS provides historical context. Past repairs, component replacements, and breakdown notes help the AI model recognize failure patterns.
- Operational Data: Information from your SCADA or MES, such as machine speed, load, or cycle counts, adds crucial context. A machine behaving unusually under a heavy load is different from one that is idle.
If you are unsure about your data readiness, a partner can help you conduct a data-readiness assessment to identify gaps and determine how to collect the necessary data without disrupting operations.
How Do We Get Our Teams to Actually Work Together?
The human element is the most critical component. If your data scientists and maintenance crews do not collaborate effectively, the project will not succeed.
The most successful programs create a cross-functional team from the beginning. This should be a small, dedicated group.
The team should include veteran maintenance engineers, an operations manager with knowledge of the production schedule, and data scientists. The maintenance and operations staff provide domain expertise to validate the AI's findings. The data scientists must be able to explain the model's logic in plain English. When this partnership functions well, the insights generated are accurate, trusted, and acted upon. This is how you effectively reduce downtime in manufacturing.
At DSG.AI, we build and deploy enterprise-grade AI systems that create real business value. Our architecture-first methodology means your predictive maintenance solution will be robust, scalable, and plugged directly into the way your teams already work. Learn more about our projects and see how we turn data into a competitive advantage.