
Written by:
Editorial Team
Editorial Team
A data pipeline is a series of automated steps that move raw information from various sources, process it, and deliver it to a destination for analysis. It is the infrastructure that turns disconnected data points into a reliable stream for business intelligence, reporting, and machine learning.
This is not just about moving files. A data pipeline is the system that converts a high volume of raw data into a clear, trustworthy asset for business decisions.
What Is a Data Pipeline and Why It Matters
A data pipeline functions like an automated assembly line for data. It collects raw materials (data from sources), processes them on an assembly line (transformation), and delivers a finished product (insights for analytics tools).
Without a pipeline, data sits unused in separate systems. With a pipeline, the system creates a continuous flow of value. For example, it can automatically pull data from a Salesforce CRM, a HubSpot marketing platform, and internal production databases. It then cleans, standardizes, and reshapes that data before loading it into a central data warehouse.
This automation removes data silos. Instead of the marketing team seeing only campaign clicks and the sales team seeing only transaction logs, a pipeline integrates this information. This allows the business to see the full picture, such as how a specific marketing campaign influenced sales revenue.
Turning Data Into a Strategic Asset
A data pipeline makes data consistently available and trustworthy. When data flows predictably, it becomes a foundation for business strategy.
- Improved Decision-Making: With access to current, accurate data, teams can make proactive decisions. An e-commerce business analyzing user behavior in near real-time can adjust its checkout flow, which can increase conversion rates by a range of 5% to 10%.
- Increased Operational Efficiency: Automating data collection and preparation frees data engineers and analysts from manual data tasks. Industry studies show that data professionals can spend up to 80% of their time gathering and cleaning data. A pipeline reduces this manual effort, allowing them to focus on analysis.
- Foundation for Advanced Applications: Data pipelines support advanced applications, such as machine learning models that predict equipment failure or personalization engines that improve customer experiences.
The global data pipeline market was valued at USD 10.01 billion in 2023 and is projected to reach USD 43.61 billion by 2032, growing at a 19.9% compound annual growth rate, according to a 2024 Fortune Business Insights report. This indicates significant investment in data infrastructure. You can discover more insights about the data pipeline market growth.
Here is a summary of what a data pipeline does for a business.
Core Functions of a Data Pipeline at a Glance
| Function | Description | Business Impact Example (Synthetic) |
|---|---|---|
| Data Ingestion | Automatically collecting raw data from various sources like databases, APIs, and logs. | Pulling daily sales figures from a point-of-sale system without manual exports. |
| Data Transformation | Cleaning, standardizing, enriching, and restructuring data into a usable format. | Converting all date formats to a single standard (YYYY-MM-DD) for accurate reporting. |
| Data Loading | Delivering the processed data to a target system, such as a data warehouse or BI tool. | Loading cleaned customer data into a central warehouse for a 360-degree customer view. |
| Orchestration | Managing the sequence, scheduling, and dependencies of all the steps in the pipeline. | Ensuring that marketing data is processed before sales data to correctly attribute revenue. |
| Monitoring | Tracking the health, performance, and data quality of the pipeline to ensure reliability. | Alerting the data team if a data source API fails, preventing stale reports. |
This table shows how each technical function of the pipeline supports a specific business need, ensuring data is not just moved, but made useful.
The Essential Components of a Data Pipeline
To understand what a data pipeline does, it is necessary to examine its core components. Each part has a specific function, and they work together to convert raw data into a clean, analysis-ready format.
Let's trace a customer purchase on an e-commerce site to see how these parts work together.
Data Sources and Ingestion
Every pipeline starts at a source, which is where data is generated. Sources can include an application database, a SaaS tool like a CRM, event streams from a website, or flat files.
For a single e-commerce purchase, data is generated in several places simultaneously:
- Website Clickstream: Raw event data tracks clicks, page views, and items added to a cart.
- Transactional Database: A system like PostgreSQL or MySQL logs the final order details, payment status, and shipping information.
- CRM System: The customer's profile in a platform like Salesforce is updated with their purchase history.
Ingestion is the first active step: pulling raw data from these different systems into the pipeline. This could be a batch job that runs hourly to collect new orders or a real-time stream that captures website clicks as they happen.
The diagram below shows this high-level flow.
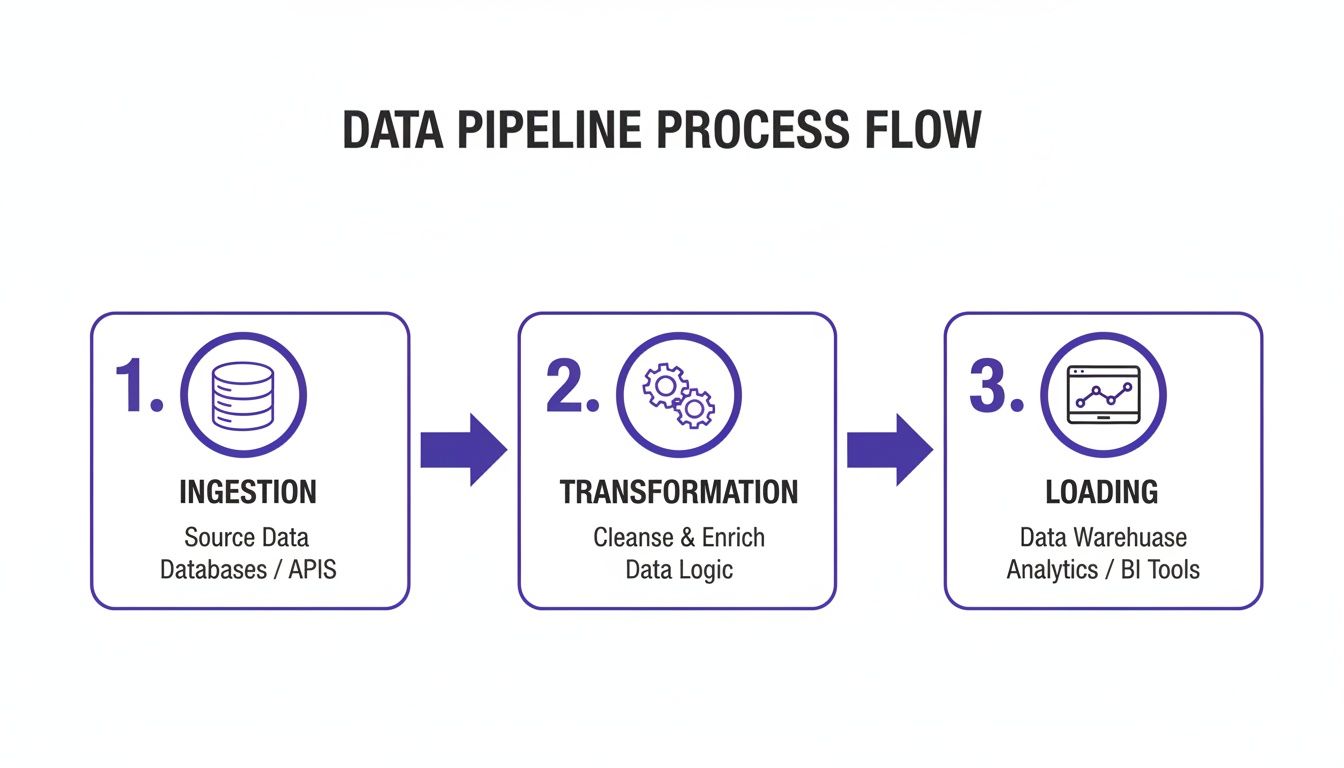
This is a structured process designed to refine raw inputs into valuable outputs.
Transformation and Loading
Once data is ingested, it is rarely ready for use. Raw data is often inconsistent, incomplete, and unstructured. Transformation is the step where data is cleaned, reshaped, and made consistent.
A data pipeline without a transformation step is like a car factory shipping raw steel and parts to a customer. The potential value is there, but the end user cannot use it.
For our e-commerce order example, the transformation stage might include:
- Cleaning: Fixing typos in a shipping address or removing duplicate "add to cart" events.
- Standardizing: Converting all timestamps to UTC to avoid time zone conflicts.
- Enriching: Joining order data with customer information from the CRM to add details like lifetime value or location.
After the data is processed, the final step is loading it into its destination. This is typically a system designed for analytics, such as a data warehouse (Snowflake or Google BigQuery) or a data lake. In our example, the cleaned order data is loaded into the company's data warehouse, where the analytics team can run reports on sales trends.
Orchestration and Automation
A data pipeline is a workflow that needs management. Orchestration schedules the jobs, handles dependencies (e.g., ensuring ingestion finishes before transformation starts), and manages errors.
Orchestration tools automate this process, allowing the pipeline to run on a schedule without manual intervention. This automation enables reliable, consistent data delivery. Platforms like DSG.AI's ZeroFlow offer a way to build and manage complex data workflows without extensive coding, which can reduce the time required for production.
2. Key Architectural Patterns: Batch vs. Streaming
Data arrives in different ways. Sometimes it comes in large, scheduled chunks, and other times it is a continuous flow. The method for handling the data depends on the business question and how quickly an answer is needed.
This difference leads to two main architectural patterns for data pipelines: batch processing and streaming processing.
Consider a bank account. A monthly statement is an example of batch processing. The bank collects all transactions over a month, processes them together, and sends a complete report. This is efficient for historical review.
In contrast, a fraud alert text message is an example of streaming processing. The system processes a single suspicious event immediately and sends an alert. Speed is the primary requirement.
Batch Processing: The Reliable Workhorse
Batch processing handles large, defined sets of data on a regular schedule, such as hourly or daily. This approach is efficient for tasks that do not require real-time answers.
Batch pipelines are used for tasks like:
- End-of-day financial reporting.
- Weekly inventory updates.
- Monthly customer billing cycles.
The main advantage of batch processing is high throughput, meaning it can process large datasets cost-effectively. The trade-off is high latency, as the insights are from a past period.
Streaming Processing: The Need for Speed
Streaming architecture processes data continuously, event by event, as it is created. This is necessary when decisions must be made in seconds.
Streaming is used for:
- Real-time fraud detection.
- Live website analytics for personalization.
- IoT sensor monitoring to predict equipment failure.
Understanding event-driven architecture patterns is important for building such systems. Streaming provides ultra-low latency but often requires more complex infrastructure.
The table below summarizes the core differences.
Comparing Batch and Streaming Data Pipelines
| Characteristic | Batch Processing | Streaming Processing |
|---|---|---|
| Data Scope | Processes large, finite blocks of data. | Processes individual events or micro-batches continuously. |
| Latency | High (minutes, hours, or days). | Low (milliseconds or seconds). |
| Throughput | Optimized for high volume. | Optimized for immediate response. |
| Data Size | Gigabytes, Terabytes, or Petabytes. | Kilobytes or Megabytes per event. |
| Typical Use Cases | End-of-day reporting, payroll, billing. | Fraud detection, live analytics, IoT monitoring. |
| Analysis | Complex analysis on historical data. | Simple analysis, aggregation, and filtering on live data. |
| Cost Model | Generally more cost-effective for large volumes. | Can be more expensive due to "always-on" infrastructure. |
The choice is not about which pattern is better, but which is appropriate for the task. Many organizations use a hybrid approach, using batch for historical analysis and streaming for real-time operations.
A Modern Twist: From ETL to ELT
Historically, batch pipelines used the ETL (Extract, Transform, Load) pattern. Data was pulled from a source, transformed on a separate server, and then loaded into a data warehouse. This was standard when computing power and storage were more expensive.
Today, scalable cloud data warehouses have led to the ELT (Extract, Load, Transform) pattern.
With ELT, you extract raw data and load it directly into the target system first. All transformation happens later, inside the data warehouse, using its processing power.
This change has a significant impact. It gives analysts direct access to raw data, allowing them to transform it for different projects. This flexibility means teams can experiment and find new insights faster without needing an engineer to rebuild the pipeline for every new question.
Choosing the Right Tools for Your Data Pipeline
Selecting the right tools for a data pipeline can be difficult due to the large number of options available. Instead of comparing features, it is better to start with clear criteria based on business needs.
This approach shifts the focus from "which tool has more features?" to "which tool will scale with us, fit our budget, and avoid a re-platform in two years?" Making the right decision early can prevent expensive rework later.
Key Evaluation Criteria for Pipeline Tools
When evaluating tools, consider both current requirements and future needs. Focus on these four factors.
-
Scalability and Performance: Can the tool handle the expected data volume in three years? A solution that works with gigabytes of data may fail with terabytes. Look for platforms that can scale compute and storage resources independently and handle both batch and streaming data if required.
-
Total Cost of Ownership (TCO): TCO includes licensing, infrastructure costs, and the time the team spends on development and maintenance. An open-source tool may appear free, but if it requires constant attention from senior engineers, its TCO can exceed that of a commercial alternative.
-
Ease of Use and Integration: How quickly can the team learn the tool? A tool with a low-code interface can enable more people to build and manage pipelines, which prevents specialized engineers from becoming a bottleneck. Check for pre-built connectors for key data sources and destinations.
-
Governance and Security: Does the tool include features for data governance, access control, and security? Pipelines in an enterprise setting must meet compliance standards. This requires built-in capabilities like data lineage, audit trails, and encryption for data in transit and at rest.
Understanding the Tooling Landscape
Data pipeline tools can be grouped into three main categories.
- Open-Source Frameworks: Tools like Apache Airflow, Kafka, and Spark offer significant power and flexibility but require expert knowledge to build and maintain.
- Cloud-Native Services: Cloud providers—AWS, Google Cloud, and Azure—offer managed services like AWS Glue and Google Cloud Dataflow. These reduce infrastructure management and integrate well with their respective ecosystems.
- Commercial Platforms: These are often end-to-end solutions with a user-friendly interface. They typically offer good support and a faster time-to-value but can lead to vendor lock-in.
The data pipeline tools market was valued at USD 11.24 billion and is projected to reach USD 29.63 billion by 2029, growing at a CAGR of 21.3% according to a 2024 Research and Markets report. This growth is driven by the rise of AI and the need for new architectures to process data at the edge. You can learn more about these data pipeline market trends.
The right tool enables the team. A platform that reduces development friction and allows for quick iteration will deliver business value faster than a technically superior but cumbersome alternative.
Choosing a platform with strong data orchestration is particularly important. A good orchestration engine manages complex workflows to ensure they run on time. For more information, you can explore the principles of building robust data orchestration systems.
By using these criteria, you can select a toolset that solves current problems and provides a solid foundation for the future.
Building Reliable and Enterprise-Grade Pipelines
When a data pipeline is critical to business operations, its reliability is essential. A broken or untrustworthy pipeline is a direct risk to business intelligence and customer trust. To build robust, enterprise-grade systems, it is necessary to design for scale, secure all layers, and implement strong data governance from the start.
This means anticipating risks before they become problems. For a practical guide, this article on how to build data pipelines provides step-by-step instructions that align with these principles.
Scaling and Securing Your Data Infrastructure
A pipeline built for a startup's data volume will not handle enterprise-level demand. Scalability requires maintaining performance and cost-efficiency as workloads grow. This calls for an architecture where compute and storage can scale independently.
Security must be integrated into the pipeline's design. Enterprise-grade security involves multiple layers of defense:
- Access Control: Implementing role-based access so users and applications can only access authorized data.
- Data Encryption: Protecting data both in transit (moving between systems) and at rest (stored in a database or data lake).
- Compliance Adherence: Building the pipeline to meet standards like GDPR, CCPA, or HIPAA from the beginning.
The Critical Role of Monitoring and Observability
In any complex system, failures will occur. The ability to quickly detect, diagnose, and fix issues is what separates a minor problem from a crisis.
Traditional monitoring is the first line of defense. It answers the question, "Is the pipeline working?" by tracking known metrics like CPU usage or job completion rates.
Observability goes deeper. It helps answer the question, "Why is the pipeline not working correctly?" Observability provides engineers with contextual data to understand the system's internal state by analyzing its external outputs. It helps troubleshoot unknown problems.
Monitoring is like a smoke detector—it alerts you to a problem. Observability is like a security system with cameras. It shows you the details so you can address the root cause, not just the symptom.
The market for data pipeline observability solutions, valued at USD 912 million, is projected to reach USD 2,520.4 million by 2035. With pipelines expected to become four times more complex by 2030, this growth highlights the need for tools that provide reliability and transparency.
Implementing Proactive Data Governance
Data governance is the framework that ensures data is managed securely, consistently, and in compliance with regulations. Within a data pipeline, this means establishing standards for data quality, lineage, and lifecycle management.
Key components of an effective governance strategy include:
- Data Quality Checks: Building automated validation rules into the pipeline to catch issues like null values or incorrect formats.
- Data Lineage Tracking: Tracing data from its origin to its destination. This creates an audit trail for compliance and debugging.
- Portfolio Management: Maintaining a centralized view of all data and AI assets. Understanding the health of this portfolio is a core part of governance, which platforms like https://dsg.ai/manageai are designed to handle.
By integrating these practices, a data pipeline becomes a trusted, resilient, and secure asset that supports critical business operations.
Common Mistakes to Avoid When Building Data Pipelines
Building a solid data pipeline requires anticipating potential problems. Avoiding a few common mistakes can prevent a project from becoming a source of constant issues.
The most common mistake is assuming data is clean. It is easy to focus on the tools and code and neglect the quality of the raw material. This leads to the "garbage in, garbage out" problem, where flawed data compromises analytics and business reports. It can be months before anyone notices that dashboards are based on bad data, by which time credibility has been damaged.
Ignoring Future Scale and Flexibility
Another common error is building a pipeline that is too rigid. Designing a solution for only today's problem creates issues later. For example, a pipeline hardcoded to pull from one specific CRM works well until the company acquires a business that uses a different system.
What should be a simple integration becomes a major overhaul. The system must be rebuilt because the original design was not flexible. A better approach is to use modular components that can be easily replaced.
A data pipeline should be designed like a set of LEGO bricks, not a sculpture. Adding a new feature or swapping a data source should be like adding a new piece, not re-carving a monolithic structure.
Neglecting Monitoring and Observability
Many teams treat monitoring as an add-on after the first major outage. Without proactive monitoring, silent data corruption or slow performance degradation can go unnoticed for weeks. By the time the problem is discovered, a significant cleanup effort is required.
Instead, build monitoring and observability into the pipeline from the beginning. This is not just about checking if the pipeline ran, but if it ran correctly.
- Data Freshness Checks: Receive an alert if a data source has not been updated on schedule.
- Volume Monitoring: Monitor the amount of data flowing through the pipeline. A sudden spike or drop often indicates a problem.
- Data Quality Validation: Run automated checks for nulls, duplicates, or unexpected schema changes at every stage.
With these practices, monitoring becomes a proactive system for ensuring data health. For any organization that depends on what is data pipelines for critical decisions, this is essential for building trust and reliability.
Frequently Asked Questions About Data Pipelines
This guide has covered the basic components of data pipelines and their architectural patterns. Here are answers to some common questions.
What Is the Difference Between a Data Pipeline and ETL?
A "data pipeline" is a general term for any system that moves data from one point to another.
ETL (Extract, Transform, Load) is a specific type of data pipeline. It follows a sequential process:
- Extract: Data is pulled from its source.
- Transform: The data is cleaned and restructured on a separate server before reaching its destination.
- Load: The processed data is loaded into the target data warehouse.
While every ETL process is a data pipeline, not all data pipelines are ETL. Modern approaches like ELT (loading raw data first and transforming it later) and real-time streaming are also data pipelines.
How Much Coding Is Required to Build a Data Pipeline?
The amount of coding depends on the tools used. The choice should align with the team's skills and the project's complexity.
Building a pipeline from scratch with open-source frameworks like Apache Spark or Beam requires strong coding skills, typically in Python or Java. This provides maximum control but requires significant development and maintenance time.
The trend is shifting toward low-code and no-code data integration platforms. These tools allow engineers and analysts to build pipelines using visual interfaces. This approach can reduce initial development time by a range of 50% to 70% compared to manual coding, according to internal benchmarks from platform vendors.
How Do I Measure the Success of a Data Pipeline?
A successful data pipeline delivers business value. To measure success, track both technical performance and business impact.
Here is a balanced approach:
-
Technical Health Checks:
- Data Latency: How current is the data? (e.g., seconds, minutes, hours).
- Uptime/Success Rate: What percentage of jobs complete successfully? The enterprise benchmark is often 99.9% or higher.
- Throughput: How much data is moved per hour or day?
-
Business Impact Metrics:
- Time-to-Insight: Are analysts getting answers faster?
- Adoption Rate: Are people and systems using the data produced by the pipeline?
- ROI: Can the data be linked to specific business outcomes, like a successful marketing campaign?
A great data pipeline reliably delivers trusted data that helps an organization make better, faster decisions.
At DSG.AI, we specialize in building enterprise-grade AI and data solutions that deliver measurable business value. Our architecture-first approach ensures your systems are scalable, reliable, and free from vendor lock-in. See how we turn data into a competitive advantage by exploring our work.