
Written by:
Editorial Team
DSG.AI
In machine learning, a loss function measures how well an algorithm models data. It calculates a penalty for each incorrect prediction the model makes. A larger penalty signifies a larger error, signaling to the model that it needs to adjust its parameters to produce more accurate results.
What a Loss Function Actually Does
A machine learning model is a prediction engine. Its purpose is to find patterns in data to make informed predictions about new, unseen information. The loss function is the mechanism that tells the model whether its predictions are accurate.
Consider it a game of "hot and cold." As you search for a hidden object, a friend tells you "warmer" when you get closer and "colder" when you move away. The loss function provides this essential feedback to the model during its training phase.
The Coach in the Code
You can think of the loss function as the model's coach. During training, for every prediction the model makes, the coach compares it to the actual correct answer and assigns a penalty score.
- A low score (getting warmer) means the prediction was close to the correct value. The model receives a small penalty, a signal that it is on the right path.
- A high score (getting colder) means the prediction was far from the correct value. This results in a heavy penalty, indicating that a significant adjustment is needed.
This continuous feedback loop is the engine of machine learning. The model has a single objective: to minimize its total penalty score across all training data. By methodically reducing this score, it becomes more accurate. This concept's origins trace back to 18th-century statisticians like Pierre-Simon Laplace, who worked on minimizing estimation errors. The idea was later formalized by Abraham Wald in the 1940s, providing the mathematical foundation for quantifying the cost of being incorrect.
A loss function translates the abstract goal of "being accurate" into a concrete, measurable number. The model's training process is a systematic effort to make that number as close to zero as possible.
From Penalty Score to Better Predictions
The penalty score is not just for tracking performance; it is a roadmap for improvement. The model uses the score to determine how it was wrong and in which direction to adjust its internal parameters. This adjustment process, called optimization, is how the model learns.
This core principle is vital in every application of AI. For example, as the financial world explores machine learning's impact on finance, a solid grasp of these mechanics is required. Whether the goal is predicting stock prices or flagging fraudulent transactions, the loss function forces the model to learn from the data and produce a useful output. It defines what a "good" prediction looks like and steers the model toward it.
Common Loss Functions for Regression Models
When a model's task is to predict a continuous number—such as a house price, tomorrow's temperature, or a stock's future value—it is a regression problem. Loss functions for these tasks measure the distance between a numerical prediction and the actual value. Three common functions are Mean Squared Error (MSE), Mean Absolute Error (MAE), and Huber Loss.
Each of these functions penalizes errors differently. Understanding their behavior is crucial for selecting the right one to match your data and business goals.
Mean Squared Error (MSE): The Strict Punisher
Mean Squared Error, or MSE, is one of the most common loss functions in regression. Its method is straightforward: it calculates the difference between the model's prediction and the actual value, then squares it. The final loss is the average of all these squared differences.
The squaring operation is significant. It means that MSE penalizes larger errors exponentially more than small ones.
- A prediction that is off by $2,000 receives a penalty of 4,000,000.
- A prediction that is off by $10,000 receives a penalty of 100,000,000. This is a 25 times larger penalty for a 5 times larger error in this synthetic example.
This makes MSE highly sensitive to outliers. A few data points with extreme values can disproportionately influence the training process, pulling the model in their direction. This is not always a negative outcome. If large errors are catastrophic for your business, such as in financial forecasting where a massive error could lead to significant capital loss, you want a model that is heavily penalized for making them.
Mean Absolute Error (MAE): The Forgiving Pragmatist
In contrast, Mean Absolute Error, or MAE, takes a more linear and less dramatic approach. It calculates the absolute difference between the predicted and actual values and averages them. There is no squaring involved.
The penalty grows in direct proportion to the error.
A $10,000 error is treated as exactly twice as bad as a $5,000 error. Because MAE does not amplify the impact of large errors, it is inherently more robust to outliers.
If your dataset contains anomalies or data entry errors that you do not want the model to over-focus on, MAE is often a better choice. It provides a more balanced view of the model's performance across all predictions, rather than focusing on the worst ones.
The chart below gives a visual sense of the goal. A lower loss score means the model's predictions are getting closer to the actual values.
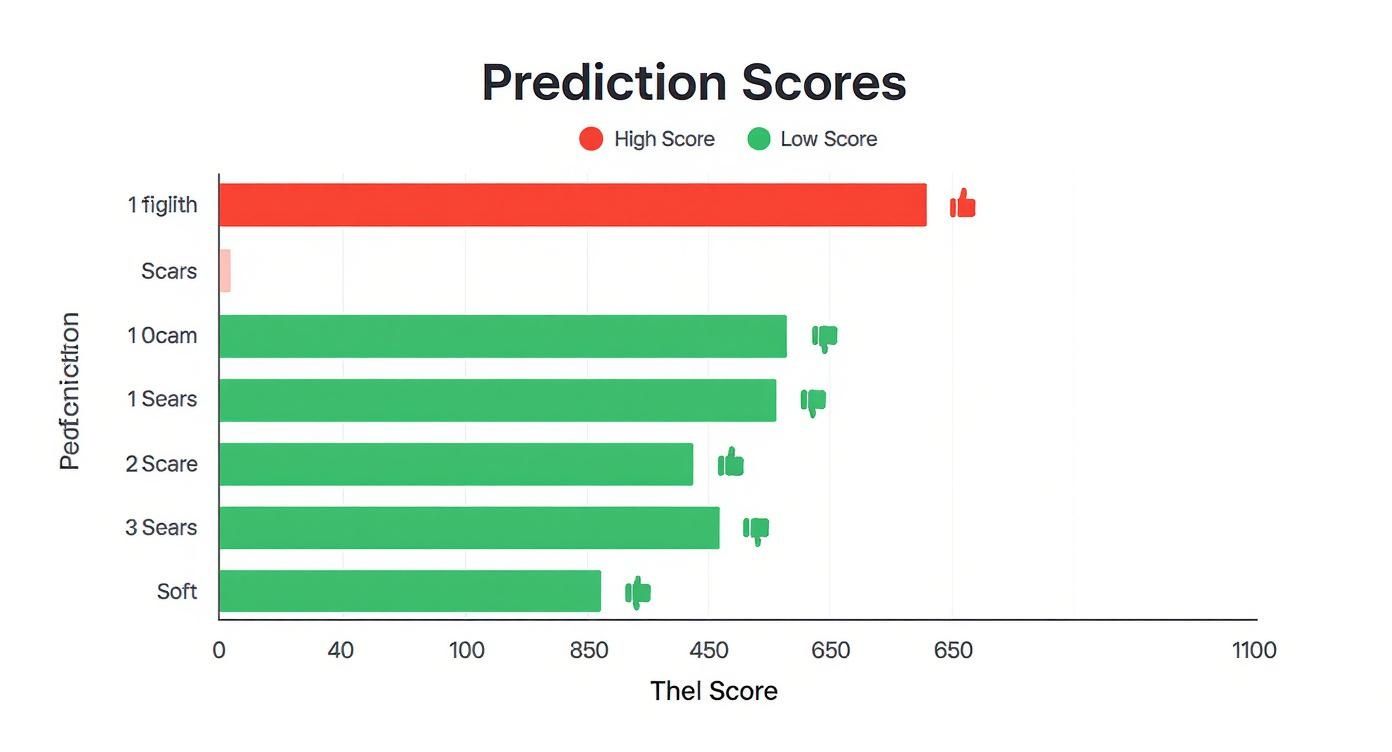
As shown, a low loss score is the objective, signaling that the model's predictions are closely aligned with the actual outcomes.
Comparing Common Regression Loss Functions
To make the choice clearer, let's compare these functions. Each has a distinct profile in how it treats errors, particularly the outliers that appear in real-world data.
| Loss Function | Mathematical Intuition | Sensitivity to Outliers | Primary Use Case |
|---|---|---|---|
| Mean Squared Error (MSE) | Squares the difference, heavily penalizing large errors. | High | When large errors are disproportionately costly and must be avoided. |
| Mean Absolute Error (MAE) | Takes the absolute difference, treating all errors linearly. | Low | When the dataset contains outliers that should not dominate training. |
| Huber Loss | A hybrid: quadratic for small errors, linear for large errors. | Medium (Tunable) | Balancing sensitivity to small errors with robustness to outliers. |
This table highlights the fundamental trade-off: do you need a loss function that aggressively punishes large errors (MSE), or one that takes a more measured, robust approach (MAE)? Or, perhaps, a balance between the two?
Huber Loss: The Balanced Hybrid
What if you need a model that is sensitive enough to correct small errors but not so sensitive that a few extreme outliers disrupt its training? This is where Huber Loss is effective, offering a middle ground between MSE and MAE.
Huber Loss uses a hyperparameter, typically called delta (δ), to set a threshold and switch its behavior based on the size of the error.
- For small errors (below δ): It acts like MSE, using a quadratic function. This provides precision for fine-tuning predictions that are already close to the correct value.
- For large errors (above δ): It switches to act like MAE, using a linear function. This prevents outliers from having an outsized, disruptive influence on the model.
By combining these two strategies, Huber Loss provides balanced, reliable performance. It offers the sensitivity of MSE for typical errors while incorporating the robustness of MAE to handle unexpected ones. This makes it a flexible choice for many real-world scenarios where data is rarely perfect.
Essential Loss Functions for Classification Models

While regression models predict numbers, classification models predict categories. They answer questions like, "Is this email spam or not?" or "Which department should this support ticket go to?" This shift from predicting continuous values to assigning discrete labels requires a different type of loss function designed to work with probabilities.
The standard for this task is Cross-Entropy Loss, often called log loss. It is effective because it measures the "distance" between the probabilities your model predicts and the actual outcome. It considers not just whether the model’s best guess was right, but also how confident the model was in its prediction.
The adoption of neural networks for complex classification tasks solidified cross-entropy's role. An analysis of winning Kaggle solutions between 2015 and 2020 shows that over 80% of top classification models used a form of it. For example, in a 2018 competition on predicting customer churn, 87% of the winning models were built on binary cross-entropy, based on a review of public solutions. You can explore more about loss functions in machine learning on datacamp.com.
Binary Cross-Entropy for Two-Choice Problems
When a problem has only two possible outcomes, we use Binary Cross-Entropy. This is the standard loss function for tasks like:
- Spam Detection: Is an email
spamornot spam? - Medical Diagnosis: Is a tumor
malignantorbenign? - Customer Churn: Will a customer
churnorstay?
This loss function penalizes a model that is both confident and wrong. Imagine a synthetic example where a spam filter is 99% sure an email is safe. If that email is actually a phishing attempt, Binary Cross-Entropy applies a massive penalty.
This steep penalty for confident mistakes is a crucial feature. It forces the model to learn to be more calibrated about its own uncertainty, which is essential for reliable production systems.
Conversely, if the model correctly flags a spam email with 99% confidence, the penalty is minimal. This behavior pushes the model not just to be right, but to be confidently right.
Categorical Cross-Entropy for Multi-Class Problems
When you have more than two options, such as sorting an image into categories like cat, dog, bird, or fish, you need Categorical Cross-Entropy. The core idea is the same, but it is generalized to handle any number of classes.
Here, the model outputs a probability for every possible category. In a synthetic example, it might look like this:
- Cat: 70%
- Dog: 20%
- Bird: 8%
- Fish: 2%
If the image was, in fact, a cat, the loss function calculates a small penalty based on that high 70% probability. But if the ground truth was dog, the penalty would be much larger because the model only assigned it a 20% chance.
Why Cross-Entropy Is the Standard
Cross-entropy is the default for most classification tasks because its mathematical structure aligns with the goal of maximizing the probability of the correct class. It works well with the activation functions (like Softmax) typically used in the final layer of a classification network.
This synergy creates a smooth and stable training process. The large penalties for confident errors generate strong signals (gradients) that tell the model exactly how to correct its mistakes efficiently. This is why it is the backbone of systems from simple logistic regression to complex deep learning models today.
How to Choose the Right Loss Function
Selecting the right loss function is a critical decision that extends beyond simply identifying a problem as regression or classification. The skill lies in connecting a mathematical penalty to a tangible business outcome. Using a default function risks building a model that pursues the wrong objective—one that is technically correct but operationally ineffective.
The process begins with a simple question: what does the business actually care about? The answer will dictate how you should penalize different kinds of mistakes. A model is only as good as the goal you set for it, and the loss function is your most direct way to define that goal.
Aligning Errors with Business Impact
Every prediction error has a real-world consequence. The objective is to pick a loss function that punishes errors in a way that mirrors their real-world cost. This requires a clear understanding of operational risks and objectives.
Consider a synthetic example of a logistics company that needs to predict package delivery times. The business impact of being wrong is not symmetrical.
- Many small errors: If the model is off by 10-15 minutes on most deliveries, it is an annoyance but manageable.
- A few catastrophic errors: If the model predicts a package will arrive today, and it arrives two days late, it creates a significant business problem. This can lead to customer complaints, increased support calls, and refunds that cost the company 1.5 to 2 times more in operational overhead.
In this scenario, Mean Squared Error (MSE) is a good choice. Because it squares the error, it penalizes large, multi-day delays heavily. The model learns to avoid these business-critical failures, even if it means accepting a few more smaller, less consequential misses.
Choosing a loss function is about translating business pain into a mathematical penalty. If large mistakes are exponentially more damaging than small ones, your loss function should reflect that.
Accounting for Data Quality and Outliers
Your dataset's characteristics are as important as your business goals. Real-world data can be messy, containing outliers, typos, and anomalies. How your loss function reacts to these outliers can determine whether your model is reliable or unpredictable.
Imagine a retail company forecasting weekly store sales. In their historical data, one week shows a 300% sales spike due to a large local festival. This is a true outlier—a one-time event not part of the normal business rhythm.
- Using MSE: A model trained with MSE would view that spike as a catastrophic error. It might adjust its entire logic to account for that single week, leading to overly optimistic forecasts for every other normal week.
- Using MAE or Huber Loss: Mean Absolute Error (MAE) treats that error linearly. It recognizes it as a large mistake but does not let it dominate the training process. Huber Loss acts similarly, treating the outlier linearly while still optimizing precisely for smaller, more typical errors.
By choosing a more robust loss function like MAE or Huber Loss, you instruct the model to focus on the general pattern, not the exceptions. This prevents it from overreacting to noisy data points. A structured framework to assess AI model risks and compliance can help identify these issues before they affect a production model.
Stepping Up to Advanced and Custom Loss Functions
Standard loss functions like Mean Squared Error and Cross-Entropy are effective for a wide range of problems. But what happens when a problem does not fit a standard framework?
This is where designing a custom loss function becomes necessary. Instead of selecting an off-the-shelf function, you build one from scratch. The goal is to create a penalty score that perfectly mirrors a unique and often complex business objective. This elevates the loss function from a simple training component to a core piece of the strategic solution.
Why Go Beyond Standard Penalties?
Standard functions are effective at measuring general error, but custom functions can be engineered to measure more nuanced concepts—such as similarity, dissimilarity, or the realism of a generated image.
This shift in thinking has been a catalyst in deep learning. The introduction of adversarial loss with Generative Adversarial Networks (GANs) in 2014 was a significant development. According to an analysis of publication archives, specialized loss functions were featured in over 40% of deep learning research papers published in 2022, a substantial increase from less than 10% in 2010. You can dig deeper into these trends in this detailed research paper on arxiv.org.
Triplet Loss: Teaching a Model What "Similar" Means
Triplet Loss is a clear example of a custom loss function. It is used in many facial recognition and image retrieval systems. Its purpose is not to classify an image but to teach the model the concept of similarity.
It operates on a principle using three images at a time:
- Anchor: The reference image (e.g., a photo of a specific dog, Sparky).
- Positive: Another photo of Sparky, perhaps from a different angle.
- Negative: A photo of a different dog.
The loss function's goal is to push the model to place the anchor and positive images close together in its internal representation, while pushing the anchor and negative images far apart. It penalizes the model if it represents the other dog as being more similar to Sparky than Sparky himself.
By engineering the penalty this way, the model learns to create clusters of similar faces or objects—a more sophisticated concept than simple classification.
Adversarial Loss: The Engine of Creativity in GANs
Another custom function is Adversarial Loss, the driving force behind Generative Adversarial Networks (GANs). GANs consist of two neural networks competing against each other: a Generator that creates new data (like photorealistic faces) and a Discriminator that tries to identify the fakes.
The adversarial loss function creates a zero-sum game:
- The Generator aims to minimize the loss by creating fakes that fool the Discriminator.
- The Discriminator aims to maximize the loss by becoming better at identifying the fakes.
This continuous competition forces both models to improve. The Generator becomes more skilled at creating realistic outputs, while the Discriminator becomes a more effective detector. This demonstrates how a loss function can be more than just an error metric; it can create a competitive dynamic that produces highly realistic results that a standard function could not achieve alone.
Putting Loss Functions to Work in Production

Moving a model from a development environment to a live production system introduces new challenges. The focus shifts from achieving high accuracy on a static dataset to ensuring reliable performance over time.
In this context, the loss function in machine learning serves a dual purpose. During training, it guides the model. In production, it acts as a monitoring tool for the MLOps pipeline.
Monitoring the loss value over time is a critical practice. A sudden spike in the average loss score is a strong indicator that something in the real world has changed. This often points to data drift, meaning the input data no longer resembles the data the model was trained on. Early detection allows teams to intervene before the model's performance degradation becomes a significant business problem.
Connecting Model Optimization to Business KPIs
A common issue is a data science team building a model that is technically excellent but operationally ineffective. This occurs when the model’s objective—the loss function it is minimizing—is disconnected from the business's actual goals.
Consider a retail sales forecasting model. If trained using a standard Mean Absolute Error (MAE), the model will work to minimize its average prediction error across all products.
However, the business may not care about the average error. Their primary KPI might be preventing stockouts of the top 20 best-selling items. An MAE-optimized model might slightly under-predict demand for a top-selling product to balance an over-prediction for a less popular one. The model's loss score may look good, but the company loses revenue from empty shelves.
The task of a production-focused data scientist is to align mathematical optimization with operational success. The loss function is the most powerful tool for building this bridge and ensuring the model's definition of "good" matches the business's definition.
Practical Steps for Production Alignment
To ensure your model delivers business value, this alignment must be established from the beginning and maintained through strong governance. Smart ML model management and workflow automation are key to successful orchestration of these components.
Here are three concrete steps to get started:
- Translate KPIs into Penalties: Work with business owners to understand the cost of different errors. If overpredicting inventory by 100 units is twice as expensive as underpredicting by 100 units, this should be encoded directly into your loss function. A custom, asymmetric loss function can mirror business reality.
- Monitor Loss Segments: A single, global loss score can hide problems. Track the loss for important data segments, such as high-value customers or critical product lines. Segment-level monitoring can reveal issues that an overall average would miss.
- Establish Alerting Thresholds: Turn monitoring into an active defense system. Set up automated alerts that trigger when the production loss exceeds a predetermined threshold—for example, 15-20% above the baseline established during validation.
When you treat the loss function as a core strategic component of your production system, you build models that deliver business value, not just high accuracy scores in a lab.
Frequently Asked Questions
Understanding the loss function in machine learning often leads to questions about related concepts. Let's clarify some of the most common ones.
What Is the Difference Between a Loss Function and a Metric?
Both loss functions and metrics measure model performance, but they serve different purposes and audiences.
- Loss Function: This is the model's guide during training. It must produce a differentiable number that the optimization algorithm can use to calculate gradients and adjust the model's parameters.
- Metric: This is for human evaluation. A metric like accuracy, precision, or F1-score is chosen because it reflects business goals and is easy for stakeholders to understand. It does not need to be differentiable.
In short, the loss function is what the machine learns from, while the metric is what the team reports on.
Can You Use More Than One Loss Function?
Yes, and it is common in advanced models. You can create a composite loss function by combining several individual loss functions, often with weights to indicate their relative importance.
This approach is useful when a model has multiple objectives. In object detection, for instance, the model must identify what an object is (a classification task) and where it is in an image (a regression task). This requires a composite loss that combines a classification loss (like Cross-Entropy) with a regression loss (like MSE for bounding box coordinates).
How Do Loss Functions and Optimizers Work Together?
They are two parts of the same mechanism that drives machine learning.
The loss function calculates how wrong the model is, and the optimizer uses the gradient of that error to determine how to adjust the model's parameters to be less wrong.
Imagine the loss function creates a landscape of hills and valleys, where the lowest points represent the smallest error. The optimizer is like a hiker trying to reach the bottom of the deepest valley. It uses the gradient—the steepness of the hill calculated from the loss—to determine the downward direction and takes a small step. This process is repeated thousands of times until the optimizer can no longer find a lower point.
For more deep dives into machine learning fundamentals, you can explore additional resources on the DSG.AI blog.
At DSG.AI, we design, build, and operationalize enterprise-grade AI systems tailored to your unique data and processes, ensuring your models deliver measurable business value. Discover our scalable, reliable solutions for your next project at https://www.dsg.ai/projects.