
Written by:
Editorial Team
Editorial Team
Data modeling is the process of structuring and organizing data. It is a blueprint that defines how information is connected, processed, and stored to support a specific business purpose, such as enterprise AI.
Why Data Modelling Is the Blueprint for AI Success
Many enterprise leaders pursue AI initiatives only to find that projects are expensive, slow, and unreliable. The problem is rarely a lack of data or algorithms; it is the absence of a solid data foundation. Data modeling provides this foundation, acting as an architectural blueprint that converts raw data into a coherent structure ready to power accurate AI models.
Consider the construction of a skyscraper. Concrete is not poured without a detailed blueprint showing the foundation, support beams, and floor plans. Building an AI system on poorly organized data is like building that skyscraper on sand—it will be unstable and eventually collapse. A correct data structure is a strategic imperative that directly drives business outcomes. This is especially true when designing AI agent input pipelines, where structure is fundamental.
Connecting Models to Business Value
Strategic data modeling from the start de-risks AI investments and builds systems designed for scale. This approach leads to measurable business improvements.
A 2022 survey of Fortune 500 data leaders found that organizations with well-defined data models reduced data processing costs by 20-30% and cut model deployment times from months to weeks. The result is faster time-to-value and a more reliable AI ecosystem.
Structuring information for business is not a new concept. It became a critical discipline in the 1960s with the rise of management information systems. This era produced the first foundational data models: hierarchical, network, and eventually, the relational model. These were the first systematic attempts to organize enterprise data and set the stage for the complex systems built today.
Ultimately, the data modelling techniques selected will determine an AI system's performance, reliability, and scalability. A solid data architecture ensures that as the business grows, its AI capabilities can grow with it, turning data from a liability into a competitive advantage. You can determine if your foundation is solid with an AI readiness assessment.
A Practical Taxonomy of Modern Data Modelling Techniques
Choosing the right data modelling technique requires knowing which tool to use for a specific business problem. The correct choice helps build an AI system that delivers measurable ROI. The wrong choice results in a costly, tangled data silo that produces no value.
Every technique offers a unique way of structuring information. Some are suited for the predictable world of traditional business intelligence. Others are built for the complex and interconnected data that defines modern business challenges. Understanding these differences is the first step in designing a data architecture to power a company's AI ambitions.
The goal is to create a blueprint that connects the data strategy directly to business outcomes, driving value, speed, and accuracy for every AI initiative.
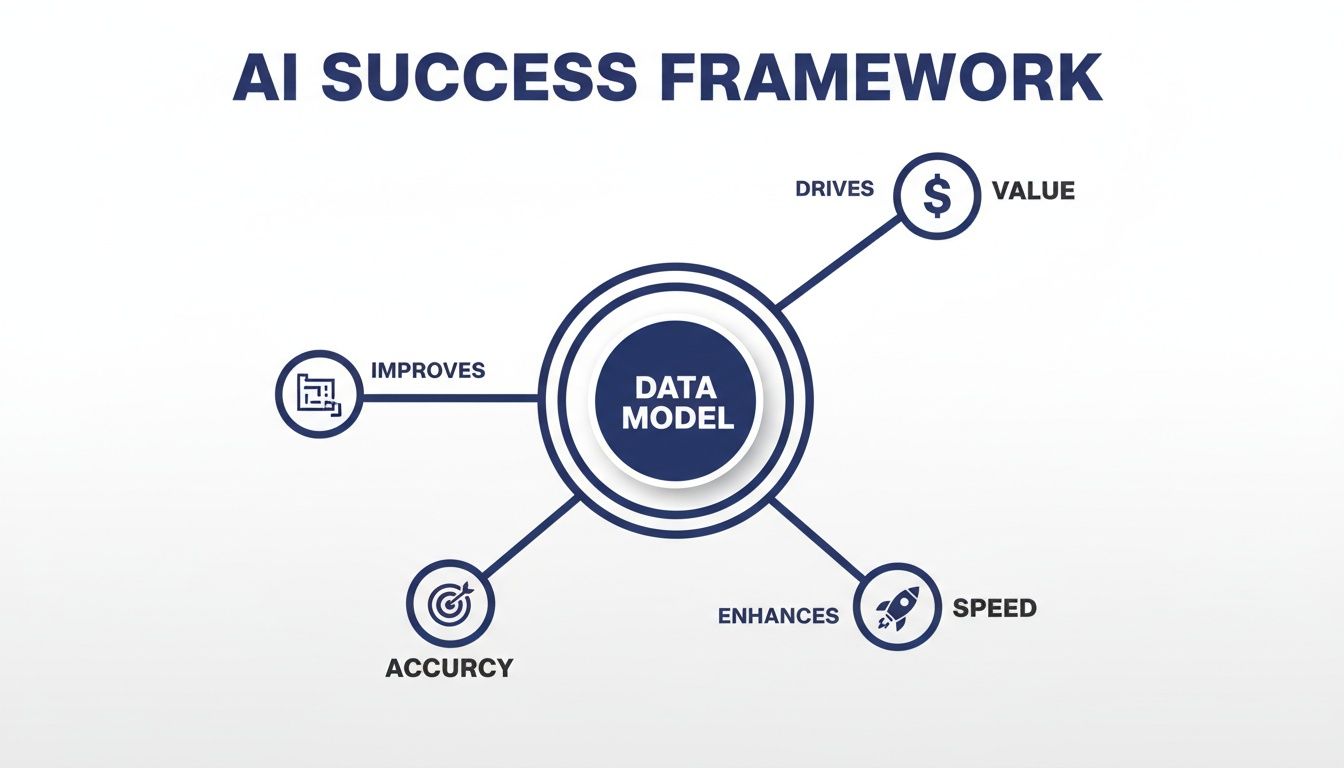
This framework illustrates that a well-designed data model is the engine driving AI performance. Without it, efforts to increase speed or accuracy often fail to produce lasting results.
Relational and Dimensional Models: The Bedrock of BI
For decades, relational models have been the standard for enterprise data. They organize information into tables with predefined rows and columns, enforcing strict, logical connections. For example, a CRM system has a Customers table, an Orders table, and a Products table, linked by unique IDs. This structured approach ensures data integrity and consistency.
Dimensional models are a specialized type of relational model, optimized for analytics and business reporting. They typically feature a central "fact" table holding key metrics, such as sales figures. This is connected to several "dimension" tables that provide context, like time, location, or product category. This "star schema" layout is efficient, allowing analysts to query data for reports quickly.
These models are most effective when data is highly structured and business questions are predictable. Their rigidity can become a bottleneck when working with the semi-structured or unstructured data that fuels most advanced AI applications.
Graph Models: Mapping Complex Connections
Business operations often function as a network. Supply chains, social media, fraud rings, and customer journeys are systems of interconnected entities. Graph models represent and analyze these complex relationships. Instead of tables, they use nodes (to represent entities like people or products) and edges (to represent the relationships between them).
This approach is effective for use cases where the connections between data points are more significant than the data points themselves.
- Fraud Detection: A graph model can identify suspicious patterns, such as multiple accounts sharing the same device ID, that would require slow and complicated queries in a relational database.
- Recommendation Engines: By mapping relationships between users and items, graph models can uncover non-obvious recommendations. In some retail environments, this has been shown to increase cross-sell opportunities by 5-10%.
- Supply Chain Optimization: Graphs can model an entire logistics network, allowing a business to identify bottlenecks and reroute shipments.
While powerful, graph models are not a universal replacement. They require specialized databases and a different approach to querying data.
Peter Chen's invention of the Entity Relationship Diagram (ERD) in the 1970s was a significant step. Before the ERD, data system design was often disorganized, making it difficult for business and technical teams to align. Chen's model provided the first standardized way to visualize data architecture, laying the groundwork for modern operational and analytical systems.
Representation Learning: Translating Data for Machines
Much of the world's valuable information is unstructured data, such as text from customer emails, satellite images, or audio from support calls. AI models cannot work with this raw information directly. Representation learning is a set of techniques, primarily using deep learning, that translates complex, unstructured data into a numerical format—called an embedding—that machines can process.
An embedding is a dense vector of numbers that captures the semantic meaning of the original data. For instance, a trained model would create vectors for the words "king" and "queen" that are mathematically close. This allows AI to perform sophisticated tasks.
This technique is fundamental to modern AI, powering applications from language translation to medical imaging. The choice of data model can affect system design, so it is worth considering how different approaches align with various microservices architecture design patterns, as data structure can influence how a service is built.
Comparison of Data Modelling Techniques for AI Applications
The following table compares these key data modelling techniques to help leaders select the best approach based on their AI use case, data type, and scalability needs.
| Technique | Primary Use Case | Best for Data Type | Scalability | Example Application |
|---|---|---|---|---|
| Relational & Dimensional | Business Intelligence, Reporting, OLAP | Structured | High (vertically) | Generating quarterly sales reports from transactional data. |
| Graph Models | Network Analysis, Relationship Discovery | Connected, Semi-structured | High (horizontally) | Identifying a complex fraud ring in financial transactions. |
| Representation Learning | Natural Language Processing, Computer Vision | Unstructured (text, images, audio) | Very High (with distributed computing) | Powering a semantic search engine for internal documents. |
| Time-Series Models | Forecasting, Anomaly Detection | Sequential, Timestamped | Moderate to High | Predicting equipment failure based on sensor data streams. |
| Probabilistic Models | Causal Inference, Risk Assessment | Any (often with uncertainty) | Varies by complexity | Determining the factors that most influence customer churn. |
Each of these models provides a different way to view data. The key is to match the model to the problem, ensuring the data architecture is a strategic asset.
How to Select the Right Data Model for Your Use Case
Knowing the different data modelling techniques is one part of the process; selecting the right one for a project is another. Without a structured framework, teams often use familiar methods rather than the most effective ones. This can lead to projects that are slow, expensive, and difficult to scale.
A structured selection process provides clarity. It shifts the conversation from "what can we build with this data?" to "what business problem are we trying to solve?" This change in perspective helps ensure the chosen model is the most direct path to a solution.

The best approach consists of four steps, moving from the business goal to the technology. This sequence helps prevent costly rework and ensures the final architecture is fit for purpose.
Step 1: Define the Business Question
This is the most critical step. It is necessary to define the specific business decision the model will drive. A vague goal like "improve logistics" is not actionable. A specific, measurable target is needed to guide technical choices.
For example, a logistics company might set its objective as: "How can we reduce fleet fuel costs by 10% versus the Q3 baseline by optimizing delivery routes?" This provides clear success criteria and indicates the data and analysis required.
Step 2: Analyze Data Characteristics
With a focused business question, the next step is to analyze the available data. This means assessing its structure, volume, and velocity.
- Structure: Is the data organized in tables (structured), like JSON logs (semi-structured), or free-form like driver text messages (unstructured)?
- Volume: Does the data measure in gigabytes or petabytes? The scale will influence the choice of database and model.
- Velocity: How quickly is the data generated, and how fast does it need to be processed? Real-time GPS streams have different requirements than nightly batch updates.
For the logistics example, the company is dealing with high-velocity GPS streams (time-series data), structured order manifests (relational data), and semi-structured real-time traffic updates. This mix indicates that a single modelling technique will not be sufficient.
Step 3: Evaluate Performance and Scalability
Next, performance and scalability requirements must be evaluated. These technical constraints are as important as the business goal.
A model that provides a perfect answer two hours too late is a business failure. Defining latency and throughput needs upfront is essential for designing a system that delivers value in a relevant timeframe.
Ask these questions:
- Latency: How quickly is an answer needed? Does a route need to be optimized in milliseconds, or can the calculation run overnight?
- Throughput: How many requests or transactions does the system need to handle per second at peak times?
- Future Growth: How much will data volume and query complexity grow over the next 24 months? The model must handle future load, not just today's.
The right data model balances analytical power and operational reality. For more on managing the performance of these complex AI systems, see our guide on AI model portfolio management.
A Synthetic Example in Logistics
Let's apply this four-step framework to our logistics company. Their goal is a 10% fuel cost reduction.
- Business Question: "How can we reduce fuel costs by 10% versus the Q3 baseline by optimizing delivery routes?" (This example is synthetic.)
- Data Analysis: They are working with real-time GPS data (location over time), order manifests (customer locations), and live traffic data (road network conditions).
- Performance Needs: Route optimizations must be available in near real-time to react to changing traffic, which requires low-latency responses.
- Scalability: The fleet is expected to grow by 20% year-over-year, so the system must scale accordingly.
The analysis shows that a single data model will not work. A time-series model is suitable for processing the GPS streams to predict travel times. To find the most efficient path through a road network, a graph model is the best choice, as it is designed to handle interconnected nodes (intersections) and edges (roads).
The conclusion is that a hybrid approach combining time-series and graph data modelling techniques is necessary to meet the business objective. This methodical process provides a logical path from a business problem to a technical solution.
Real-World Examples of Data Modelling in Action
Theory is useful, but seeing models deliver tangible results demonstrates their value. The following are examples of how the right data modelling approach solved specific business problems.
These scenarios from different industries detail a challenge, the model used, and the business impact. They show how a well-chosen model is a direct path to operational improvements and return on investment.
Maritime Fuel Consumption Optimization
The Problem: A global shipping company faced volatile fuel costs, which accounted for over 50% of their total voyage expenses. They needed to reduce fuel consumption by a double-digit percentage without affecting delivery schedules.
The Model: A single model was not sufficient. The solution was a hybrid of several techniques.
- First, a time-series model analyzed years of historical voyage data, including vessel speed, engine RPM, and fuel flow rates from onboard sensors. This provided a performance baseline and allowed for consumption forecasts under different scenarios.
- Next, representation learning processed unstructured weather data. Advanced models converted atmospheric and oceanographic information—wind speed, wave height, current patterns—into numerical vectors, or embeddings, that a machine could process.
Fusing these two models created a predictive engine. The system could run thousands of simulations for potential routes, weighing the fuel impact of a speed change against the latest weather forecasts.
The Outcome: The company provided its captains with optimized voyage plans that adapted to real-world conditions. The result was a 9-14% reduction in fuel costs within the first six months, which translated into millions of dollars in annual savings while meeting delivery deadlines.
Healthcare Patient Deterioration Prediction
The Problem: A large hospital network struggled to predict which patients were at high risk of sudden clinical deterioration, such as sepsis or cardiac arrest. Existing early warning systems generated too many false alerts, causing "alert fatigue" among nurses. This meant clinicians were sometimes slow to respond to patients who were genuinely at risk.
The Model: The data science team built a probabilistic/causal model to understand the cause of a patient's declining health. This model continuously processed data from multiple sources:
- Real-time vital signs (heart rate, blood pressure).
- Structured lab results from the hospital's information system.
- Patient history and comorbidity data from electronic health records.
By modeling the probabilistic relationships between these factors, the system could calculate the likelihood of a patient's condition worsening over the next 6-12 hours. It could also highlight the reasons for a high-risk score, such as a dangerous combination of specific lab results and unstable vitals. This context was key to earning clinicians' trust.
A model that can not only predict an outcome but also explain its reasoning is significantly more valuable in high-stakes environments like healthcare. Causal models help bridge the gap between AI-driven insights and confident clinical decision-making.
The Outcome: The new probabilistic model led to a 20% improvement in early intervention rates for at-risk patients and reduced false alerts by over 30%. Clinical staff could focus their attention where it was most needed, leading to better patient outcomes.
Retail Supply Chain and Inventory Management
The Problem: A major retail chain experienced inventory issues: popular items were often out of stock, while warehouses were overstocked with unwanted products. This mismatch resulted in lost sales and increased holding costs. Their old forecasting system, which relied on past sales, could not keep up with changing trends and promotions.
The Model: The solution was a multi-layered approach that blended several data models.
- A dimensional model was built in their data warehouse to provide a consolidated view of sales, inventory, and promotions across all stores.
- On top of this structured data, a time-series forecasting model predicted baseline demand for every product in every store.
- The final component was a knowledge graph, which captured complex relationships between products, store locations, and external events like local festivals. The graph provided context that the time-series model lacked.
The Outcome: This combination of models provided the retailer with a more accurate and agile inventory management system. They reduced stockouts on high-demand products by 15% and cut excess inventory costs by 12%. The improved forecasts also allowed them to fine-tune their supply chain, delivering the right products to the right stores at the right time.
Weaving Data Models into Your Enterprise Architecture
Choosing the right data modelling technique is one part of the process; integrating it into the enterprise architecture is another. A data model is the foundation that dictates how data flows, is transformed, and delivers value, impacting everything from the data warehouse to MLOps pipelines.
This requires thinking beyond the model itself to its architectural footprint. A model for a machine learning feature store has different transformation and latency requirements than one for a traditional data lake. One requires real-time processing, while the other can use daily batch updates.
The architectural patterns must serve the model's purpose. For example, using a knowledge graph as a semantic layer can unify disparate data sources across the company, creating a common business language on top of siloed information. This enables more powerful analytics without a massive data migration project.

Governance and Observability: The Unspoken Stakeholders
Effective governance is a direct result of modeling choices. In a world shaped by regulations like the EU AI Act, the ability to trace data lineage, detect bias, and explain model behavior is non-negotiable.
The chosen data model affects how easy or difficult this becomes:
- Data Lineage: Simpler structures like dimensional schemas make it straightforward to trace data from source to report. Complex representation learning models can create a "black box," obscuring lineage and requiring additional governance layers.
- Bias Detection: The model defines which attributes are available for analysis. A poorly designed model that obscures key demographic data makes it nearly impossible to audit for algorithmic fairness.
- Model Explainability: Some models are more transparent than others. A causal model can show the factors that drove a decision, offering more clarity than a deep learning model. This is where a technical choice directly impacts the business need for risk management.
How Modern Computing Changed the Game
The computational revolution of the 1980s changed data modeling. Methods like Markov chain Monte Carlo (MCMC) overcame old computational barriers, allowing for massive simulations that were previously impossible. You can learn more by exploring the history of modern statistics.
This shift is critical for today's enterprise AI. We are no longer limited by the need for neat mathematical solutions or rigid assumptions about data distributions. We can build and integrate more complex, accurate models, provided our architecture can support them.
Choosing a data model is not merely a technical decision; it's a governance decision. The structure you impose on your data will either simplify or complicate your ability to maintain transparency, ensure fairness, and comply with emerging AI regulations.
Architectural Patterns for MLOps and Compliance
To operationalize AI, your architecture must support the entire model lifecycle. This requires establishing clear patterns for how data models feed into MLOps pipelines and compliance platforms.
Here are a few common patterns:
- Centralized Feature Stores: Data is modeled and transformed into a central feature store. This creates a single source of truth for ML teams, ensuring consistency. Teams adopting this often see a 30-40% reduction in feature engineering time.
- Data Mesh Architecture: In this decentralized model, different business domains own their "data products," including models. This promotes agility but requires strong central governance.
- Governance as a Service: A dedicated platform monitors model outputs for compliance, watching for data drift, bias, and adherence to regulations.
Getting these patterns right is key to ensuring your data models are manageable, scalable, and compliant. To see how these pieces fit together, see our guide on designing a modern MLOps orchestration platform.
Common Questions About Enterprise Data Modelling
A few common questions often arise when implementing new data modelling techniques. Answering them correctly helps ensure that technical choices support business goals and that AI projects deliver value.
How Do Models Differ for Analytics vs. Operational AI?
The main difference between data models for analytics and those for operational AI is speed and purpose.
Analytical models, like dimensional schemas, are designed for historical research and reporting. The priority is to allow analysts to query large datasets to identify trends. Updates may occur every few hours or once a day.
Operational AI models are integrated into live business processes. They must provide a prediction or decision in milliseconds to be useful. This requires data structures built for near-instant lookups and real-time data streams. For example, a model flagging fraud at checkout cannot wait for a nightly batch job.
What Is a Data Model's Role in an MLOps Pipeline?
In an MLOps pipeline, the data model is the agreement between data engineering and machine learning. It defines the shape, format, and meaning of the data a production model needs.
A well-defined data model acts as the central nervous system of an MLOps pipeline. It guarantees that the data used for training is structurally identical to the data used for inference, which is the single most critical factor in preventing silent model failures in production.
This consistency is crucial. Without a strictly enforced data model, small changes in upstream data sources can create "data drift," causing a model’s accuracy to decline. The model becomes the blueprint for feature stores, validation checks, and monitoring systems.
How Can We Future-Proof Our Data Models?
"Future-proofing" a data model means designing for change. The goal is to build a core architecture that can grow with the business without requiring a complete rebuild every few years.
Following three key principles can make a difference:
- Modularity: Design models in reusable components. This allows for easy swapping or adding of new pieces, like a new data source, without disrupting the entire system.
- Abstraction Layers: Keep raw data separate from the logical layer the business uses. A semantic layer, such as a knowledge graph, allows changes to underlying databases without breaking reports and models that depend on stable business definitions.
- Governance from Day One: Integrate data governance and metadata management into the design from the beginning. Knowing what data you have, where it came from, and how it is used allows you to adapt models with confidence as requirements change.
Focusing on these principles helps build a resilient data foundation.
At DSG.AI, we specialize in designing and building these resilient, enterprise-grade AI systems that create measurable value. Our architecture-first approach ensures your data models are not just technically sound but are built to scale and adapt with your business. Explore our successful AI projects to see how we turn data into a competitive advantage.